2013 Atlantic hurricane season
| 2013 Atlantic hurricane season |
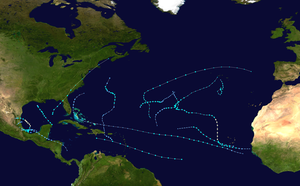
Season summary map
|
| Seasonal boundaries |
| First system formed |
June 5, 2013 |
| Last system dissipated |
December 7, 2013 |
| Strongest storm |
|
| Name |
Humberto |
| • Maximum winds |
90 mph (150 km/h)
(1-minute sustained) |
| • Lowest pressure |
979 mbar (hPa; 28.91 inHg) |
| Seasonal statistics |
| Total depressions |
15 |
| Total storms |
14 |
| Hurricanes |
2 |
Major hurricanes
(Cat. 3+) |
0 |
| Total fatalities |
47 total |
| Total damage |
At least $1.51 billion (2013 USD) |
| Related articles |
|
|
Atlantic hurricane seasons
2011, 2012, 2013, 2014, 2015
|
| Tropical storm (SSHWS) |
|
|
| Duration |
June 5 – June 7 |
| Peak intensity |
65 mph (100 km/h) (1-min) 992 mbar (hPa) |
| Tropical storm (SSHWS) |
|
|
| Duration |
June 17 – June 20 |
| Peak intensity |
45 mph (75 km/h) (1-min) 1003 mbar (hPa) |
| Tropical storm (SSHWS) |
|
|
| Duration |
July 7 – July 10 |
| Peak intensity |
65 mph (100 km/h) (1-min) 1003 mbar (hPa) |
| Tropical storm (SSHWS) |
|
|
| Duration |
July 23 – August 3 |
| Peak intensity |
60 mph (95 km/h) (1-min) 1002 mbar (hPa) |
| Tropical storm (SSHWS) |
|
|
| Duration |
August 15 – August 18 |
| Peak intensity |
45 mph (75 km/h) (1-min) 1006 mbar (hPa) |
| Tropical storm (SSHWS) |
|
|
| Duration |
August 25 – August 26 |
| Peak intensity |
60 mph (95 km/h) (1-min) 1001 mbar (hPa) |
| Tropical storm (SSHWS) |
|
|
| Duration |
September 4 – September 13 |
| Peak intensity |
65 mph (100 km/h) (1-min) 1003 mbar (hPa) |
| Tropical depression (SSHWS) |
|
|
| Duration |
September 6 – September 7 |
| Peak intensity |
35 mph (55 km/h) (1-min) 1008 mbar (hPa) |
| Category 1 hurricane (SSHWS) |
|
|
| Duration |
September 8 – September 19 |
| Peak intensity |
90 mph (150 km/h) (1-min) 979 mbar (hPa) |
The 2013 Atlantic hurricane season was a below average Atlantic hurricane season and the first since 1994 with no major hurricanes. It was also the first season since 1968 with no storms of at least Category 2 intensity on the Saffir–Simpson hurricane wind scale. The first tropical cyclone of this hurricane season, Andrea, developed on June 5, while the final cyclone, an unnamed subtropical storm, dissipated on December 7. Throughout the year, only two storms – Humberto and Ingrid – reached hurricane intensity; this was the lowest seasonal total since 1982.
The season's impact was minimal; although 15 tropical cyclones developed, most were weak or remained at sea. Tropical Storm Andrea killed four people after making landfall in Florida and moving up the East Coast of the United States. In early July, Tropical Storm Chantal moved through the Leeward Islands, causing one fatality, but minimal damage overall. Tropical storms Dorian and Erin and Hurricane Humberto brought only squally weather to the Cape Verde Islands. Mexico, where Hurricane Ingrid, Tropical Depression Eight, and tropical storms Barry and Fernand all made landfall, was the hardest hit; Ingrid alone caused at least 32 deaths and $1.5 billion (2013 USD) in damage. In early October, Karen brought showers and gusty winds to the central Gulf Coast of the United States.
All major forecasting agencies predicted an above-average season. All reduced their seasonal predictions in early August, but even the revised predictions were too high. The lack of activity was primarily caused by an unexpected significant weakening of the Atlantic Ocean thermohaline circulation between winter and spring. This resulted in continuation of the spring weather pattern over the Atlantic Ocean, with strong vertical wind shear, mid-level moisture, and atmospheric stability, which suppressed tropical cyclogenesis.
...
Wikipedia


