2013 Pacific hurricane season
| 2013 Pacific hurricane season | |
|---|---|

Season summary map
|
|
| Seasonal boundaries | |
| First system formed | May 15, 2013 |
| Last system dissipated | November 4, 2013 |
| Strongest storm | |
| Name | Raymond |
| • Maximum winds | 125 mph (205 km/h) (1-minute sustained) |
| • Lowest pressure | 951 mbar (hPa; 28.08 inHg) |
| Seasonal statistics | |
| Total depressions | 21 |
| Total storms | 20 |
| Hurricanes | 9 |
| Major hurricanes (Cat. 3+) |
1 |
| Total fatalities | 135 confirmed |
| Total damage | $4.201 billion (2013 USD) (Costliest season in East Pacific history) |
| Related articles | |
| Tropical storm (SSHWS) | |
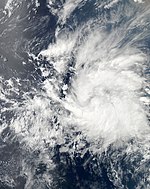
| Duration | May 15 – May 17 |
|---|---|
| Peak intensity | 60 mph (95 km/h) (1-min) 1000 mbar (hPa) |
| Category 1 hurricane (SSHWS) | |
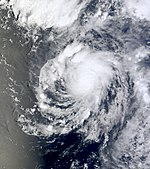
| Duration | May 28 – May 30 |
|---|---|
| Peak intensity | 80 mph (130 km/h) (1-min) 983 mbar (hPa) |
| Category 1 hurricane (SSHWS) | |
| Duration | June 23 – June 27 |
|---|---|
| Peak intensity | 85 mph (140 km/h) (1-min) 980 mbar (hPa) |
| Category 1 hurricane (SSHWS) | |
| Duration | June 29 – July 7 |
|---|---|
| Peak intensity | 80 mph (130 km/h) (1-min) 984 mbar (hPa) |
| Category 1 hurricane (SSHWS) | |
| Duration | July 4 – July 9 |
|---|---|
| Peak intensity | 80 mph (130 km/h) (1-min) 983 mbar (hPa) |
| Tropical storm (SSHWS) | |
| Duration | July 25 – July 30 |
|---|---|
| Peak intensity | 70 mph (110 km/h) (1-min) 994 mbar (hPa) |
| Category 1 hurricane (SSHWS) | |
| Duration | July 30 – August 6 |
|---|---|
| Peak intensity | 85 mph (140 km/h) (1-min) 985 mbar (hPa) |
| Category 2 hurricane (SSHWS) | |
| Duration | August 3 – August 11 |
|---|---|
| Peak intensity | 105 mph (165 km/h) (1-min) 976 mbar (hPa) |
| Tropical storm (SSHWS) | |
| Duration | August 16 – August 18 (Exited basin) |
|---|---|
| Peak intensity | 65 mph (100 km/h) (1-min) 1000 mbar (hPa) |
The 2013 Pacific hurricane season was a very active season, although most of the storms remained weak. The 2013 Pacific hurricane season was the costliest season on record within the East Pacific. It officially began on May 15, 2013 in the Eastern Pacific and started on June 1, 2013 in the Central Pacific. Both ended on November 30, 2013. These dates conventionally delimit the period of each year when most tropical cyclones form in the eastern Pacific basin. However, the formation of a storm is possible at any time.
The second storm of the season, Hurricane Barbara, brought widespread heavy rains to much of Southwestern Mexico and Central America. Damage estimates from the storm range from $750,000 to $1 million (2013 USD); four people were killed and four others are reportedly missing. In addition to Barbara, Hurricane Cosme killed three people despite remaining far offshore the Mexican coast. Hurricane Erick also brought slight effects to the region as well, killing two people. Later that month, Tropical Storm Flossie threatened to become the first storm to make a "direct hit" on Hawaii in 20 years, causing minimal damage. Ivo and Juliette both threatened Baja California Sur, and the former triggered flash floods across the Southwestern United States. In mid-September, Hurricane Manuel killed at least 169 people in Mexico, and was responsible for significant damage to the western coast and the area around Acapulco. In late October, Hurricane Raymond became the strongest storm of the season.
On May 21, the Central Pacific Hurricane Center (CPHC) released its forecast for tropical activity across the Central Pacific during 2013. In its report, the organization predicted a 70 percent chance of a below-average season, a 25 percent chance of a near-average season, and a 5 percent chance of an above-average season, equating to 1–3 tropical cyclones across the basin. An average season yields 4–5 tropical cyclones. This forecast was based primarily on the expectation of Neutral El Niño Southern Oscillation conditions and a continuation of the positive Atlantic Multidecadal Oscillation.
...
Wikipedia


