2015 Pacific hurricane season
| 2015 Pacific hurricane season |

Season summary map
|
| Seasonal boundaries |
| First system formed |
May 28, 2015 |
| Last system dissipated |
December 31, 2015 (record latest)
|
| Strongest storm |
|
| Name |
Patricia (Most intense hurricane in the Western Hemisphere)
|
| • Maximum winds |
215 mph (345 km/h) |
| • Lowest pressure |
872 mbar (hPa; 25.75 inHg) |
| Seasonal statistics |
| Total depressions |
31 (record high)
|
| Total storms |
26 |
| Hurricanes |
16 (record high)
|
Major hurricanes
(Cat. 3+) |
11 (record high)
|
| Total fatalities |
39 direct, 5 indirect |
| Total damage |
$562.63 million (2015 USD) |
| Related articles |
|
|
Pacific hurricane seasons
2013, 2014, 2015, 2016, 2017
|
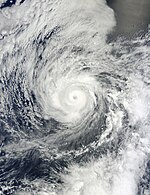
| Category 4 hurricane (SSHWS) |
|
|
| Duration |
May 28 – June 4 |
| Peak intensity |
145 mph (230 km/h) (1-min) 937 mbar (hPa) |
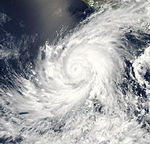
| Category 4 hurricane (SSHWS) |
|
|
| Duration |
May 31 – June 9 |
| Peak intensity |
145 mph (230 km/h) (1-min) 936 mbar (hPa) |
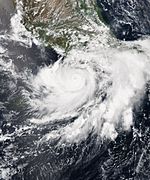
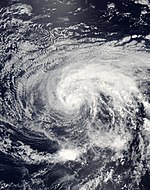
| Category 1 hurricane (SSHWS) |
|
|
| Duration |
June 10 – June 17 |
| Peak intensity |
90 mph (150 km/h) (1-min) 978 mbar (hPa) |
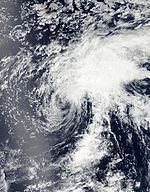
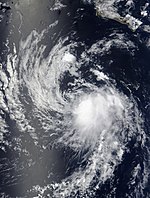
| Tropical storm (SSHWS) |
|
|
| Duration |
July 8 – July 10 |
| Peak intensity |
45 mph (75 km/h) (1-min) 1002 mbar (hPa) |
| Tropical storm (SSHWS) |
|
|
| Duration |
July 10 – July 12 (exited basin)
|
| Peak intensity |
60 mph (95 km/h) (1-min) 999 mbar (hPa) |
| Tropical storm (SSHWS) |
|
|
| Duration |
July 10 – July 13 |
| Peak intensity |
40 mph (65 km/h) (1-min) 1003 mbar (hPa) |
| Category 4 hurricane (SSHWS) |
|
|
| Duration |
July 11 – July 18 |
| Peak intensity |
130 mph (215 km/h) (1-min) 946 mbar (hPa) |
| Tropical storm (SSHWS) |
|
|
| Duration |
July 12 – July 18 |
| Peak intensity |
50 mph (85 km/h) (1-min) 1000 mbar (hPa) |
| Tropical storm (SSHWS) |
|
|
| Duration |
July 23 – July 25 |
| Peak intensity |
40 mph (65 km/h) (1-min) 1004 mbar (hPa) |
The 2015 Pacific hurricane season is the second-most active Pacific hurricane season on record with 26 named storms, only behind the 1992 season. A record-tying 16 of the storms became hurricanes, and a record 11 storms became major hurricanes throughout the season. The central Pacific, the portion of the eastern Pacific between the International Dateline and 140°W, had its most active year on record, with fifteen tropical cyclones forming in or entering the basin. Moreover, the season was the second most active season in terms of Accumulated Cyclone Energy, with a total of 286 ACE units. The season officially started on May 15 in the East Pacific Ocean and on June 1 in the Central Pacific; they both ended on November 30. These dates conventionally delimit the period of each year when most tropical cyclones form in the Pacific basin. However, the formation of tropical cyclones is possible at any time of the year. This was shown when a tropical depression existed on December 31. The above-average activity during the season was attributed in part to the strong 2014–16 El Niño event.
The season featured several long-tracking and powerful storms, although land impact was often minimal. In June, Hurricane Blanca, was an early season Category 4 hurricane that killed four people due to rough seas. Hurricane Carlos caused minor damage while passing a short distance off the coast of Mexico. On August 29, three Category 4 hurricanes (Kilo, Ignacio, Jimena) were all active simultaneously for the first time in recorded history. Moisture from Hurricane Linda killed 21 people in Utah. Later in September, Hurricane Marty was responsible for $30 million (2015 USD) in damages to the southwestern Mexican coast. In October, Hurricane Patricia became the most intense hurricane ever recorded in the Western Hemisphere, with a central pressure of 872 mbar and 1-minute sustained winds of 215 mph. After also becoming the strongest landfalling Pacific hurricane on record, Patricia claimed 13 lives and was responsible for $460 million in damages. The season's activity continued into November, when Hurricane Sandra became the strongest hurricane ever recorded in that month.
...
Wikipedia


