2016 Pacific hurricane season
| 2016 Pacific hurricane season | |
|---|---|

Season summary map
|
|
| Seasonal boundaries | |
| First system formed | January 7, 2016 (record earliest) |
| Last system dissipated | November 26, 2016 |
| Strongest storm | |
| Name | Seymour |
| • Maximum winds | 150 mph (240 km/h) (1-minute sustained) |
| • Lowest pressure | 943 mbar (hPa; 27.85 inHg) |
| Seasonal statistics | |
| Total depressions | 23 |
| Total storms | 22 |
| Hurricanes | 13 |
| Major hurricanes (Cat. 3+) |
6 |
| Total fatalities | 11 total |
| Total damage | $96 million (2016 USD) |
| Related articles | |
| Category 2 hurricane (SSHWS) | |
| Duration | January 7 – January 15 |
|---|---|
| Peak intensity | 100 mph (155 km/h) (1-min) 977 mbar (hPa) |
| Tropical depression (SSHWS) | |
| Duration | June 6 – June 8 |
|---|---|
| Peak intensity | 35 mph (55 km/h) (1-min) 1006 mbar (hPa) |
| Tropical storm (SSHWS) | |
| Duration | July 2 – July 5 |
|---|---|
| Peak intensity | 50 mph (85 km/h) (1-min) 1002 mbar (hPa) |
| Category 4 hurricane (SSHWS) | |
| Duration | July 3 – July 10 |
|---|---|
| Peak intensity | 140 mph (220 km/h) (1-min) 947 mbar (hPa) |
| Category 2 hurricane (SSHWS) | |
| Duration | July 6 – July 16 |
|---|---|
| Peak intensity | 100 mph (155 km/h) (1-min) 972 mbar (hPa) |
| Category 3 hurricane (SSHWS) | |
| Duration | July 11 – July 26 |
|---|---|
| Peak intensity | 120 mph (195 km/h) (1-min) 958 mbar (hPa) |
| Tropical storm (SSHWS) | |
| Duration | July 15 – July 22 |
|---|---|
| Peak intensity | 70 mph (110 km/h) (1-min) 990 mbar (hPa) |
| Category 1 hurricane (SSHWS) | |
| Duration | July 21 – July 28 |
|---|---|
| Peak intensity | 85 mph (140 km/h) (1-min) 979 mbar (hPa) |
| Category 4 hurricane (SSHWS) | |
| Duration | July 21 – July 27 |
|---|---|
| Peak intensity | 130 mph (215 km/h) (1-min) 952 mbar (hPa) |
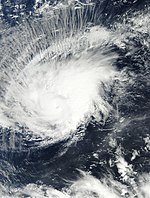
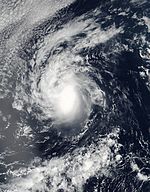
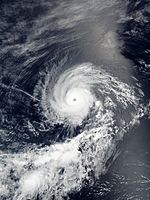
The 2016 Pacific hurricane season was the first time since 2011 in which no tropical cyclones occurred in May, and the first time since 2007 that no named storms formed in the month of June. It was another active season that produced a total of 22 named storms, 13 hurricanes and six major hurricanes. Although the season was very active, it was not as active as the previous two seasons; featuring sporadic periods of inactivity, particularly at the beginning and towards the end of the season. It officially started on May 15 in the East Pacific Ocean, and on June 1 in the Central Pacific; they both ended on November 30. These dates conventionally delimit the period of each year when most tropical cyclones form in the Pacific basin. However, as illustrated by Hurricane Pali, which became the earliest Central Pacific tropical cyclone to form on record, the formation of tropical cyclones is possible at any time of the year.
On May 6, 2016, the Servicio Meteorológico Nacional (SMN) issued its first outlook for the Pacific hurricane season, forecasting a near average season with 17 named storms, 9 hurricanes, and 4 major hurricanes. On May 27, NOAA released their outlook, forecasting 13-20 named storms, 6-11 hurricanes, and 3-6 major hurricanes. NOAA admitted that this season would be difficult to predict because of changing conditions, but both organizations cited a dissipating El Niño and the formation of a La Niña event, which resulted in the prediction of a near-normal season in both basins. In the Central Pacific, about four to seven cyclones would form or enter within the basin, citing an equal 40% chance of an above-normal or near-normal season.
The Accumulated Cyclone Energy (ACE) index for the 2016 Pacific hurricane season, as of 15:00 UTC November 26, is 183.0475 units (143.9775 units from the Eastern Pacific and 39.07 units from the Central Pacific).
As the new year began, Pali formed on January 7, two days before Tropical Storm Winona's formation in 1989. Pali subsequently surpassed Hurricane Ekeka's record and became a hurricane on January 11. When Pali reached a peak intensity of 100 mph, it surpassed Winona to become the strongest January tropical cyclone east of the dateline. Pali also reached a record low latitude of 2.0°N, beating Nine-C's record of 2.2°N to become the southern most tropical cyclone on record in the western hemisphere. Although Pali formed in January, the season kicked off to a very inactive start; for the first time since 2011, no tropical depressions or storms formed during the month of May, and no named storms formed during June since 2007.
...
Wikipedia


