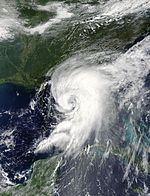
2016 Atlantic hurricane season
| 2016 Atlantic hurricane season | |
|---|---|
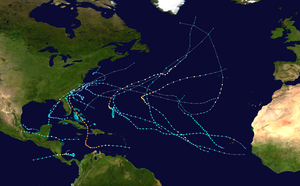
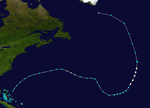
Season summary map
|
|
| Seasonal boundaries | |
| First system formed | January 12, 2016 |
| Last system dissipated | November 25, 2016 |
| Strongest storm | |
| Name | Matthew |
| • Maximum winds | 160 mph (260 km/h) (1-minute sustained) |
| • Lowest pressure | 934 mbar (hPa; 27.58 inHg) |
| Seasonal statistics | |
| Total depressions | 16 |
| Total storms | 15 |
| Hurricanes | 7 |
| Major hurricanes (Cat. 3+) |
3 |
| ACE Index | 133.41 units |
| Total fatalities | 1,805 total |
| Total damage | ≥ $11.671 billion (2016 USD) |
| Related articles | |
| Category 1 hurricane (SSHWS) | |
| Duration | January 12 – January 15 |
|---|---|
| Peak intensity | 85 mph (140 km/h) (1-min) 981 mbar (hPa) |
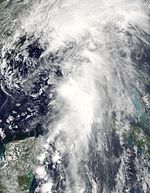
| Tropical storm (SSHWS) | |
| Duration | May 27 – June 4 |
|---|---|
| Peak intensity | 45 mph (75 km/h) (1-min) 1006 mbar (hPa) |
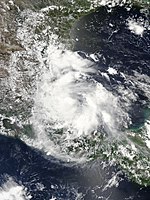
| Tropical storm (SSHWS) | |
| Duration | June 5 – June 7 |
|---|---|
| Peak intensity | 50 mph (85 km/h) (1-min) 1001 mbar (hPa) |
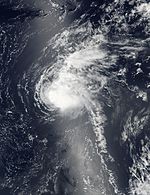
| Tropical storm (SSHWS) | |
| Duration | June 19 – June 21 |
|---|---|
| Peak intensity | 45 mph (75 km/h) (1-min) 1007 mbar (hPa) |
| Category 1 hurricane (SSHWS) | |
| Duration | August 2 – August 6 |
|---|---|
| Peak intensity | 85 mph (140 km/h) (1-min) 979 mbar (hPa) |
| Tropical storm (SSHWS) | |
| Duration | August 16 – August 23 |
|---|---|
| Peak intensity | 50 mph (85 km/h) (1-min) 1004 mbar (hPa) |
| Category 3 hurricane (SSHWS) | |
| Duration | August 22 – September 2 |
|---|---|
| Peak intensity | 120 mph (195 km/h) (1-min) 955 mbar (hPa) |
| Tropical depression (SSHWS) | |
| Duration | August 28 – September 1 |
|---|---|
| Peak intensity | 35 mph (55 km/h) (1-min) 1010 mbar (hPa) |
| Category 1 hurricane (SSHWS) | |
| Duration | August 28 – September 3 |
|---|---|
| Peak intensity | 80 mph (130 km/h) (1-min) 982 mbar (hPa) |
The 2016 Atlantic hurricane season was the most active and costliest Atlantic hurricane season since 2012 as well as the deadliest since 2005. This was an above average season that produced a total of fifteen named storms, seven hurricanes and three major hurricanes. The season officially started on June 1 and ended on November 30. The season began nearly five months before the official start, with the first storm, Hurricane Alex forming in the Northeastern Atlantic in mid-January, the first Atlantic January hurricane since Hurricane Alice in 1955. The final storm, Otto, crossed into the Eastern Pacific on November 25.
The strongest, costliest and deadliest storm of the season was Hurricane Matthew, the southernmost Category 5 Atlantic hurricane on record, and the first Category 5 hurricane to form in the Atlantic since Felix in 2007. With up to 1,659 deaths attributed to it, Hurricane Matthew was the deadliest Atlantic hurricane since Stan of 2005.
Most forecasting groups predicted above average activity due to a developing La Niña and warmer than normal sea surface temperatures. Overall, the forecasts were fairly accurate. All developed tropical cyclones, except Fiona, Ian and Lisa impacted land, and nine of those storms caused loss of life, directly or indirectly. At least 1,805 people died as of the season's end on November 30, making the 2016 season the deadliest since 2005.
Ahead of and during the season, several national meteorological services and scientific agencies forecast how many named storms, hurricanes and major hurricanes will form during a season and/or how many tropical cyclones will affect a particular country. These agencies include the Tropical Storm Risk (TSR) Consortium of the University College London, the National Oceanic and Atmospheric Administration (NOAA) and Colorado State University (CSU). The forecasts include weekly and monthly changes in significant factors that help determine the number of tropical storms, hurricanes, and major hurricanes within a particular year. Some of these forecasts also take into consideration what happened in previous seasons and the predicted weakening of the 2014–16 El Niño event. On average, an Atlantic hurricane season between 1981 and 2010 contained twelve tropical storms, six hurricanes, and two major hurricanes, with an accumulated cyclone energy (ACE) index of between 66 and 103 units.
...
Wikipedia


