2012 Atlantic hurricane season
| 2012 Atlantic hurricane season |

Season summary map
|
| Seasonal boundaries |
| First system formed |
May 19, 2012 |
| Last system dissipated |
October 29, 2012 |
| Strongest storm |
|
| Name |
Hurricane Sandy |
| • Maximum winds |
115 mph (185 km/h)
(1-minute sustained) |
| • Lowest pressure |
940 mbar (hPa; 27.76 inHg) |
| Seasonal statistics |
| Total depressions |
19 |
| Total storms |
19 |
| Hurricanes |
10 |
Major hurricanes
(Cat. 3+) |
2 |
|
ACE Index |
130.1 units |
| Total fatalities |
200 direct, 155 indirect |
| Total damage |
At least $79.2 billion (2012 USD) |
| Related articles |
|
|
Atlantic hurricane seasons
2010, 2011, 2012, 2013, 2014
|
| Tropical storm (SSHWS) |
|
|
| Duration |
May 19 – May 22 |
| Peak intensity |
60 mph (95 km/h) (1-min) 995 mbar (hPa) |
| Tropical storm (SSHWS) |
|
|
| Duration |
May 26 – May 30 |
| Peak intensity |
70 mph (110 km/h) (1-min) 992 mbar (hPa) |
| Category 1 hurricane (SSHWS) |
|
|
| Duration |
June 18 – June 22 |
| Peak intensity |
85 mph (140 km/h) (1-min) 974 mbar (hPa) |
| Tropical storm (SSHWS) |
|
|
| Duration |
June 23 – June 27 |
| Peak intensity |
65 mph (100 km/h) (1-min) 990 mbar (hPa) |
| Category 2 hurricane (SSHWS) |
|
|
| Duration |
August 1 – August 10 |
| Peak intensity |
100 mph (155 km/h) (1-min) 973 mbar (hPa) |
| Tropical storm (SSHWS) |
|
|
| Duration |
August 3 – August 6 |
| Peak intensity |
60 mph (95 km/h) (1-min) 1002 mbar (hPa) |
| Tropical storm (SSHWS) |
|
|
| Duration |
August 9 – August 18 |
| Peak intensity |
45 mph (75 km/h) (1-min) 1004 mbar (hPa) |
| Category 2 hurricane (SSHWS) |
|
|
| Duration |
August 15 – August 20 |
| Peak intensity |
110 mph (175 km/h) (1-min) 965 mbar (hPa) |
| Category 1 hurricane (SSHWS) |
|
|
| Duration |
August 21 – September 1 |
| Peak intensity |
80 mph (130 km/h) (1-min) 965 mbar (hPa) |
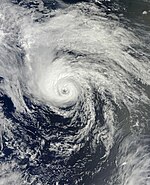
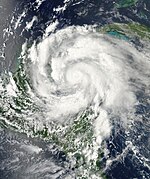
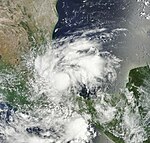
The 2012 Atlantic hurricane season was extremely active, tied with 1887, 1995, 2010, and 2011 for having the third-most named storms on record. The season officially began on June 1 and ended on November 30, dates that conventionally delimit the period during each year in which most tropical cyclones form in the Atlantic Ocean. However, Alberto, the first system of the year, developed on May 19 – the earliest date of formation since Tropical Storm Ana in 2003. A second tropical cyclone, Beryl, developed later that month. This was the first occurrence of two pre-season named storms in the Atlantic basin since 1951. It moved ashore in North Florida on May 29 with winds of 65 mph (100 km/h), making it the strongest pre-season storm to make landfall in the Atlantic basin. This season marked the first time since 2009 where no tropical cyclones formed in July. Another record was set by Hurricane Nadine later in the season; the system became the fourth-longest-lived tropical cyclone ever recorded in the Atlantic, with a total duration of 22.25 days. The final storm to form, Tony, dissipated on October 25 – however, Hurricane Sandy, which formed before Tony, became extratropical on October 29.
Pre-season forecasts by the Colorado State University (CSU) called for a below average season, with 10 named storms, 4 hurricanes, and 2 major hurricanes. The National Oceanic and Atmospheric Administration (NOAA) issued its first outlook on May 24, predicting a total of 9–15 named storms, 4–8 hurricanes, and 1–3 major hurricanes; both agencies noted the possibility of an El Niño, which limits tropical cyclone activity. Following two pre-season storms, the CSU updated their forecast to 13 named storms, 5 hurricanes, and 2 major hurricanes, while the NOAA upped their forecast numbers to 12–17 named storms, 5–8 hurricanes, and 2–3 major hurricanes on August 9. Despite this, activity far surpassed the predictions.
...
Wikipedia


