2003 Atlantic hurricane season
| 2003 Atlantic hurricane season |

Season summary map
|
| Seasonal boundaries |
| First system formed |
April 20, 2003 |
| Last system dissipated |
December 11, 2003 |
| Strongest storm |
|
| Name |
Isabel |
| • Maximum winds |
165 mph (270 km/h)
(1-minute sustained) |
| • Lowest pressure |
915 mbar (hPa; 27.02 inHg) |
| Seasonal statistics |
| Total depressions |
21 |
| Total storms |
16 |
| Hurricanes |
7 |
Major hurricanes
(Cat. 3+) |
3 |
| Total fatalities |
92 total |
| Total damage |
$5.7 billion (2003 USD) |
| Related articles |
|
|
Atlantic hurricane seasons
2001, 2002, 2003, 2004, 2005
|
| Tropical storm (SSHWS) |
|
|
| Duration |
April 20 – April 24 |
| Peak intensity |
60 mph (95 km/h) (1-min) 994 mbar (hPa) |
| Tropical depression (SSHWS) |
|
|
| Duration |
June 11 – June 11 |
| Peak intensity |
35 mph (55 km/h) (1-min) 1008 mbar (hPa) |
| Tropical storm (SSHWS) |
|
|
| Duration |
June 29 – July 2 |
| Peak intensity |
60 mph (95 km/h) (1-min) 997 mbar (hPa) |
| Category 1 hurricane (SSHWS) |
|
|
| Duration |
July 8 – July 17 |
| Peak intensity |
90 mph (150 km/h) (1-min) 979 mbar (hPa) |
| Category 1 hurricane (SSHWS) |
|
|
| Duration |
July 16 – July 21 |
| Peak intensity |
75 mph (120 km/h) (1-min) 1000 mbar (hPa) |
| Tropical depression (SSHWS) |
|
|
| Duration |
July 19 – July 21 |
| Peak intensity |
35 mph (55 km/h) (1-min) 1010 mbar (hPa) |
| Tropical depression (SSHWS) |
|
|
| Duration |
July 25 – July 27 |
| Peak intensity |
35 mph (55 km/h) (1-min) 1016 mbar (hPa) |
| Category 1 hurricane (SSHWS) |
|
|
| Duration |
August 14 – August 17 |
| Peak intensity |
75 mph (120 km/h) (1-min) 986 mbar (hPa) |
| Tropical depression (SSHWS) |
|
|
| Duration |
August 21 – August 22 |
| Peak intensity |
35 mph (55 km/h) (1-min) 1007 mbar (hPa) |
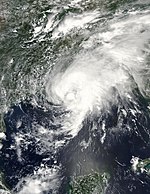
The 2003 Atlantic hurricane season was an active Atlantic hurricane season with tropical activity before and after the official bounds of the season – the first such occurrence in 49 years. The season produced 21 tropical cyclones, of which 16 developed into named storms; seven cyclones attained hurricane status, of which three reached major hurricane status. With sixteen storms, the season was tied for the sixth most active Atlantic hurricane season on record. The strongest hurricane of the season was Hurricane Isabel, which reached Category 5 status on the Saffir-Simpson Hurricane Scale northeast of the Lesser Antilles; Isabel later struck North Carolina as a Category 2 hurricane, causing $3.6 billion in damage (2003 USD, $4.69 billion 2017 USD) and a total of 51 deaths across the Mid-Atlantic region of the United States.
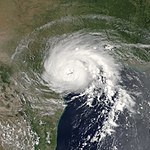
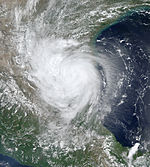
The season began with Subtropical Storm Ana on April 20, prior to the official start of the season; the bounds of the season are from June 1 to November 30, which conventionally delimit the period of each year when most tropical cyclones form in the Atlantic basin. In early September, Hurricane Fabian struck Bermuda as a Category 3 hurricane, where it was the worst hurricane since 1926; on the island it caused four deaths and $300 million in damage (2003 USD, $391 million 2017 USD). Hurricane Juan caused considerable destruction to Nova Scotia, particularly Halifax, as a Category 2 hurricane, the first hurricane of significant strength to hit the province since 1893. Additionally, Hurricanes Claudette and Erika struck Texas and Mexico, respectively, as minimal hurricanes.
...
Wikipedia


