1926 Atlantic hurricane season
| 1926 Atlantic hurricane season |

Season summary map
|
| Seasonal boundaries |
| First system formed |
July 22, 1926 |
| Last system dissipated |
November 16, 1926 |
| Strongest storm |
|
| Name |
"Miami" |
| • Maximum winds |
150 mph (240 km/h) |
| • Lowest pressure |
930 mbar (hPa; 27.46 inHg) |
| Seasonal statistics |
| Total storms |
11 |
| Hurricanes |
8 |
Major hurricanes
(Cat. 3+) |
6 |
| Total fatalities |
≥1554 |
| Total damage |
$267.4 million (1926 USD) |
|
|
Atlantic hurricane seasons
1924, 1925, 1926, 1927, 1928
|
| Category 4 hurricane (SSHWS) |
|
|
| Duration |
July 22 – July 31 |
| Peak intensity |
140 mph (220 km/h) (1-min) ≤ 967 mbar (hPa) |
| Category 3 hurricane (SSHWS) |
|
|
| Duration |
July 29 – August 8 |
| Peak intensity |
120 mph (195 km/h) (1-min) ≤ 968 mbar (hPa) |
| Category 3 hurricane (SSHWS) |
|
|
| Duration |
August 20 – August 27 |
| Peak intensity |
115 mph (185 km/h) (1-min) 955 mbar (hPa) |
| Category 4 hurricane (SSHWS) |
|
|
| Duration |
September 1 – September 21 |
| Peak intensity |
130 mph (215 km/h) (1-min) ≤ 957 mbar (hPa) |
| Category 2 hurricane (SSHWS) |
|
|
| Duration |
September 10 – September 14 |
| Peak intensity |
105 mph (165 km/h) (1-min) ≤ 1000 mbar (hPa) |
| Tropical storm (SSHWS) |
|
|
| Duration |
September 11 – September 17 |
| Peak intensity |
40 mph (65 km/h) (1-min) ≤ 1004 mbar (hPa) |
| Category 4 hurricane (SSHWS) |
|
|
| Duration |
September 11 – September 22 |
| Peak intensity |
150 mph (240 km/h) (1-min) 930 mbar (hPa) |
| Category 2 hurricane (SSHWS) |
|
|
| Duration |
September 21 – October 1 |
| Peak intensity |
105 mph (165 km/h) (1-min) ≤ 978 mbar (hPa) |
| Tropical storm (SSHWS) |
|
|
| Duration |
October 3 – October 5 |
| Peak intensity |
40 mph (65 km/h) (1-min) ≤ 1005 mbar (hPa) |
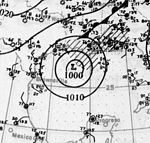
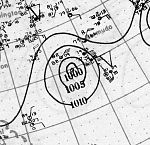
The 1926 Atlantic hurricane season featured the highest number of major hurricanes at the time. At least eleven tropical cyclones developed during the season, all of which intensified into a tropical storm and eight further strengthened into hurricanes. Six hurricanes deepened into a major hurricane, which is Category 3 or higher on the modern-day Saffir–Simpson hurricane wind scale. The first system, the Nassau hurricane, developed near the Lesser Antilles on July 22. Moving west-northwest for much of its duration, the storm struck or brush several islands of the Lesser and Greater Antilles. However, the Bahamas later received greater impact. At least 287 deaths and $7.85 million (1926 USD) in damage was attributed to this hurricane. The next cyclone primarily effected mariners in and around the The Maritimes of Canada, with boating accidents and drownings resulting in between 55 and 58 fatalities. In late August, the third hurricane brought widespread impact to the Gulf Coast of the United States, especially Louisiana. Crops and buildings suffered $6 million (1926 USD) in damage and there were 25 people killed. The next three storms left relatively little to no damage on land.
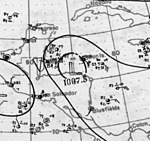
The strongest and most damaging storm of the season was Hurricane Seven, nicknamed the Miami hurricane. Peaking as a Category 4 hurricane, the hurricane struck the Bahamas and Florida at a slightly weaker intensity. Much of the Miami metropolitan area was devastated by the storm. Inland, a storm surge on Lake Okeechobee flooded towns such as Clewiston and Moore Haven. The storm was a factor in ending the Florida land boom of the 1920s. Overall, the Miami hurricane resulted in at least 372 deaths and $125 million (1926 USD) in damage. However, adjusted for wealth normalization in 2010, the damage toll would be $164.8 billion – far higher than Hurricane Katrina in 2005. The eight, ninth, and eleventh tropical cyclones left only minor or not impact on land. However, the tenth storm, nicknamed the Havana-Bermuda, devastated Cuba, the Bahamas, and ships in the vicinity of Bermuda. At least 709 deaths were linked to the system, with 600 in Cuba alone. Damage to towns on the island exceeded $100 million (1926 USD). Collectively, the storms of this season left over $267.4 million in damage and at least 1,554 fatalities.
...
Wikipedia


