2015 North Indian Ocean cyclone season
| 2015 North Indian Ocean cyclone season | |
|---|---|

Season summary map
|
|
| Seasonal boundaries | |
| First system formed | June 7, 2015 |
| Last system dissipated | November 10, 2015 |
| Strongest storm | |
| Name | Chapala |
| • Maximum winds | 215 km/h (130 mph) (3-minute sustained) |
| • Lowest pressure | 940 hPa (mbar) |
| Seasonal statistics | |
| Depressions | 12 |
| Deep depressions | 9 |
| Cyclonic storms | 4 |
| Severe cyclonic storms | 2 |
| Very severe cyclonic storms | 2 |
| Total fatalities | >363 total |
| Total damage | > $258 million (2015 USD) |
| Related articles | |
| Cyclonic storm (IMD) | |
| Tropical storm (SSHWS) | |
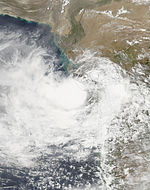
| Duration | June 7 – June 12 |
|---|---|
| Peak intensity | 85 km/h (50 mph) (3-min) 990 hPa (mbar) |
| Depression (IMD) | |
| Duration | June 20 – June 21 |
|---|---|
| Peak intensity | 45 km/h (30 mph) (3-min) 994 hPa (mbar) |
| Deep depression (IMD) | |
| Duration | June 22 – June 24 |
|---|---|
| Peak intensity | 55 km/h (35 mph) (3-min) 988 hPa (mbar) |
| Depression (IMD) | |
| Duration | July 10 – July 12 |
|---|---|
| Peak intensity | 45 km/h (30 mph) (3-min) 994 hPa (mbar) |
| Cyclonic storm (IMD) | |
| Tropical storm (SSHWS) | |
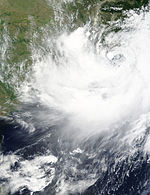
| Duration | July 26 – August 2 |
|---|---|
| Peak intensity | 75 km/h (45 mph) (3-min) 986 hPa (mbar) |
| Deep depression (IMD) | |
| Duration | July 27 – July 30 |
|---|---|
| Peak intensity | 55 km/h (35 mph) (3-min) 994 hPa (mbar) |
| Deep depression (IMD) | |
| Tropical storm (SSHWS) | |
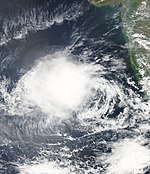
| Duration | October 9 – October 11 |
|---|---|
| Peak intensity | 55 km/h (35 mph) (3-min) 1000 hPa (mbar) |
| Extremely severe cyclonic storm (IMD) | |
| Category 4 tropical cyclone (SSHWS) | |
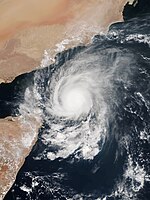
| Duration | October 28 – November 4 |
|---|---|
| Peak intensity | 215 km/h (130 mph) (3-min) 940 hPa (mbar) |
| Extremely severe cyclonic storm (IMD) | |
| Category 3 tropical cyclone (SSHWS) | |
| Duration | November 5 – November 10 |
|---|---|
| Peak intensity | 175 km/h (110 mph) (3-min) 964 hPa (mbar) |
The 2015 North Indian Ocean cyclone season was an event in the annual cycle of tropical cyclone formation. The North Indian Ocean cyclone season has no official bounds, but cyclones tend to form between April and December, with the peak from May to November. These dates conventionally delimit the period of each year when most tropical cyclones form in the northern Indian Ocean.
The scope of this article is limited to the Indian Ocean in the Northern Hemisphere, east of the Horn of Africa and west of the Malay Peninsula. There are two main seas in the North Indian Ocean — the Arabian Sea to the west of the Indian subcontinent, abbreviated ARB by the India Meteorological Department (IMD); and the Bay of Bengal to the east, abbreviated BOB by the IMD.
The official Regional Specialized Meteorological Centre in this basin is the India Meteorological Department (IMD), while the Joint Typhoon Warning Center releases unofficial advisories. On average, three to four cyclonic storms form in this basin every season.
The Accumulated Cyclone Energy (ACE) index for the season as of 06:00 UTC on November 7 is 30.9425 ACE units.
The season started rather late compared to the last two years, with the first storm, Ashobaa, not developing until June 7. Ashobaa was followed by 2 depressions, before Komen formed in July. Komen produced torrential rainfall in Bangledash. September featured no storms, before Chapala formed at the end of October. Chapala rapidly intensified over the Arabian Sea into an Extremely Severe Cyclonic Storm, becoming the strongest in the Arabian Sea since Gonu in 2007. Chapala also became the only hurricane force system to make landfall in Yemen, and the first since 1922 in Socotra. Chapala was followed by Megh, which reached a weaker intensity in the same general area.
...
Wikipedia


