1994 Atlantic hurricane season
| 1994 Atlantic hurricane season |

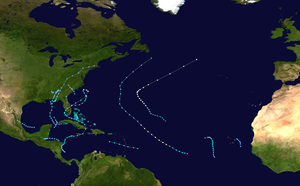
Season summary map
|
| Seasonal boundaries |
| First system formed |
June 30, 1994 |
| Last system dissipated |
November 21, 1994 |
| Strongest storm |
|
| Name |
Florence |
| • Maximum winds |
110 mph (175 km/h)
(1-minute sustained) |
| • Lowest pressure |
972 mbar (hPa; 28.7 inHg) |
| Seasonal statistics |
| Total depressions |
12 |
| Total storms |
7 |
| Hurricanes |
3 |
Major hurricanes
(Cat. 3+) |
0 |
| Total fatalities |
1,184 |
| Total damage |
~ $1.56 billion (1994 USD) |
| Related article |
|
|
Atlantic hurricane seasons
1992, 1993, 1994, 1995, 1996
|
| Tropical storm (SSHWS) |
|
|
| Duration |
June 30 – July 7 |
| Peak intensity |
65 mph (100 km/h) (1-min) 993 mbar (hPa) |
| Tropical depression (SSHWS) |
|
|
| Duration |
July 20 – July 21 |
| Peak intensity |
35 mph (55 km/h) (1-min) 1015 mbar (hPa) |
| Tropical storm (SSHWS) |
|
|
| Duration |
August 14 – August 19 |
| Peak intensity |
60 mph (95 km/h) (1-min) 999 mbar (hPa) |
| Category 1 hurricane (SSHWS) |
|
|
| Duration |
August 16 – August 23 |
| Peak intensity |
80 mph (130 km/h) (1-min) 979 mbar (hPa) |
| Tropical depression (SSHWS) |
|
|
| Duration |
August 29 – August 31 |
| Peak intensity |
35 mph (55 km/h) (1-min) 1005 mbar (hPa) |
| Tropical storm (SSHWS) |
|
|
| Duration |
September 9 – September 11 |
| Peak intensity |
70 mph (110 km/h) (1-min) 1006 mbar (hPa) |
| Tropical storm (SSHWS) |
|
|
| Duration |
September 21 – September 26 |
| Peak intensity |
60 mph (95 km/h) (1-min) 997 mbar (hPa) |
| Tropical depression (SSHWS) |
|
|
| Duration |
September 24 – September 26 |
| Peak intensity |
35 mph (55 km/h) (1-min) 1004 mbar (hPa) |
| Tropical depression (SSHWS) |
|
|
| Duration |
September 27 – September 29 |
| Peak intensity |
35 mph (55 km/h) (1-min) 1007 mbar (hPa) |
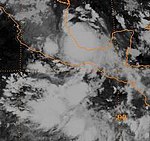
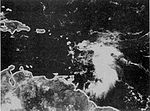
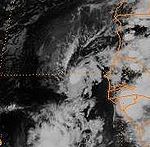
The 1994 Atlantic hurricane season produced seven named tropical cyclones and three hurricanes, a total below the Atlantic hurricane season average. It officially started on June 1 and ended on November 30, dates which conventionally limit the period during which most tropical cyclones form in the Atlantic Ocean. The first tropical cyclone, Tropical Storm Alberto, developed on June 30, while the last storm, Hurricane Gordon, dissipated on November 21. The season was unusual in that it produced no major hurricanes, which are those of Category 3 status or higher on the Saffir–Simpson hurricane scale. The most intense hurricane, Hurricane Florence, peaked as a Category 2 storm with winds of 110 mph (180 km/h). Aside from Chris, Florence, and Gordon, none of the storms exceeded tropical storm intensity.
Tropical Storm Alberto produced significant rainfall and flooding in the Southeastern United States, damaging or destroying over 18,000 homes. In August, Tropical Storm Beryl produced heavy rainfall in Florida, Georgia, South Carolina, and North Carolina, with moderate to heavy rainfall throughout several other states. Beryl caused numerous injuries, many of which occurred from a tornado associated with the tropical storm. Tropical Storm Debby killed nine people in the Caribbean in September. Hurricane Gordon was the most significant storm of the season, causing damage from Costa Rica to North Carolina among its six landfalls. Extreme flooding and mudslides from Gordon caused approximately 1,122 fatalities in Haiti. In addition, a nor'easter in December may have had tropical characteristics, though due to the uncertainty, it was not classified as a tropical system.
Forecasts of hurricane activity are issued before each hurricane season by noted hurricane experts such as Dr. William M. Gray and his associates at Colorado State University. A normal season, as defined by the National Oceanic and Atmospheric Administration, has six to fourteen named storms, with four to eight of those reaching hurricane strength, and one to three major hurricanes. The 1994 forecast predicted that a total of 10 storms would form, of which six of the storms would reach hurricane status. The forecast also projected that three of the hurricanes would reach major hurricane status.
...
Wikipedia


