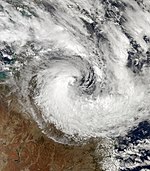
2013–14 Australian region cyclone season
| 2013–14 Australian region cyclone season |

Season summary map
|
| Seasonal boundaries |
| First system formed |
20 November 2013 |
| Last system dissipated |
26 April 2014 |
| Strongest storm |
|
| Name |
Ita |
| • Maximum winds |
215 km/h (130 mph)
(10-minute sustained) |
| • Lowest pressure |
930 hPa (mbar) |
| Seasonal statistics |
| Tropical lows |
17 |
| Tropical cyclones |
10 |
| Severe tropical cyclones |
5 |
| Total fatalities |
22 total |
| Total damage |
$1.15 billion (2014 USD) |
| Related articles |
|
|
Australian region tropical cyclone seasons
2011–12, 2012–13, 2013–14, 2014–15, 2015–16
|
| Category 1 tropical cyclone (Australian scale) |
| Tropical storm (SSHWS) |
|
|
| Duration |
20 November – 1 December |
| Peak intensity |
85 km/h (50 mph) (10-min) 991 hPa (mbar) |
| Category 3 severe tropical cyclone (Australian scale) |
| Category 3 tropical cyclone (SSHWS) |
|
|
| Duration |
16 December – 19 December (Exited basin)
|
| Peak intensity |
155 km/h (100 mph) (10-min) 961 hPa (mbar) |
| Category 4 severe tropical cyclone (Australian scale) |
| Category 3 tropical cyclone (SSHWS) |
|
|
| Duration |
25 December – 1 January |
| Peak intensity |
165 km/h (105 mph) (10-min) 948 hPa (mbar) |
| Tropical low (Australian scale) |
|
|
| Duration |
10 January – 23 January |
| Peak intensity |
35 km/h (25 mph) (10-min) 990 hPa (mbar) |
| Category 2 tropical cyclone (Australian scale) |
| Tropical storm (SSHWS) |
|
|
| Duration |
24 January – 31 January |
| Peak intensity |
100 km/h (65 mph) (10-min) 975 hPa (mbar) |
| Tropical low (Australian scale) |
|
|
| Duration |
30 January – 12 February |
| Peak intensity |
65 km/h (40 mph) (10-min) 992 hPa (mbar) |
| Category 1 tropical cyclone (Australian scale) |
|
|
| Duration |
31 January – 4 February (Exited basin)
|
| Peak intensity |
65 km/h (40 mph) (10-min) 994 hPa (mbar) |
| Category 2 tropical cyclone (Australian scale) |
|
|
| Duration |
31 January – 13 February |
| Peak intensity |
100 km/h (65 mph) (10-min) 982 hPa (mbar) |
| Category 1 tropical cyclone (Australian scale) |
| Tropical storm (SSHWS) |
|
|
| Duration |
28 February (Entered basin) – 20 March |
| Peak intensity |
85 km/h (50 mph) (10-min) 991 hPa (mbar) |
The 2013–14 Australian region cyclone season was a slightly below average tropical cyclone season. It officially started on 1 November 2013, and ended on 30 April 2014. The regional tropical cyclone operational plan defines a "tropical cyclone year" separately from a "tropical cyclone season"; the "tropical cyclone year" began on 1 July 2013 and ended on 30 June 2014.
After two seasons with no cyclones of Category 5 intensity, this season saw two of the ten named storms reaching this level: Gillian and Ita. Of the two systems, Gillian rapidly intensified from a tropical low to a Category 5 in just 48 hours but caused only minor damage. Ita was ultimately the strongest and most intense system inside the basin and made landfall on the Far North Queensland coast near Cooktown, causing minor damage but significant flooding. In addition, significant damage was also caused by Christine in the towns of Wickham and Roebourne in Western Australia while Fletcher dumped over 1250 mm of rainfall on the Queensland town of Kowanyama, making it the fifth-wettest tropical cyclone in the country on record.
Ahead of the cyclone season, the Australian Bureau of Meteorology (BoM), the New Zealand National Institute of Water and Atmospheric Research (NIWA) and various other Pacific Meteorological services, all contributed towards the Island Climate Update tropical cyclone outlook that was released during October 2013. The outlook took into account the ENSO neutral conditions that had been observed across the Pacific and analogue seasons with ENSO neutral conditions occurring during the season. The outlook called for a near average number of tropical cyclones for the 2013–14 season, with eight to twelve named tropical cyclones, to occur between 135°E and 120°W compared to an average of 10. At least four of the tropical cyclones were expected to become category 3 severe tropical cyclones, while three could become category 4 severe tropical cyclones, they also noted that a Category 5 severe tropical cyclone was unlikely to occur.
...
Wikipedia


