2015–16 Australian region cyclone season
| 2015–16 Australian region cyclone season | |
|---|---|

Season summary map
|
|
| Seasonal boundaries | |
| First system formed | 17 December 2015 |
| Last system dissipated | 16 March 2016 |
| Strongest storm | |
| Name | Stan |
| • Maximum winds | 110 km/h (70 mph) (10-minute sustained) |
| • Lowest pressure | 975 hPa (mbar) |
| Seasonal statistics | |
| Tropical lows | 11 |
| Tropical cyclones | 3 |
| Severe tropical cyclones | None |
| Total fatalities | Unknown |
| Total damage | Unknown |
| Related articles | |
| Tropical low (Australian scale) | |
| Duration | 17 December – 23 December |
|---|---|
| Peak intensity | Winds not specified 1006 hPa (mbar) |
| Tropical low (Australian scale) | |
| Duration | 21 December – 1 January |
|---|---|
| Peak intensity | 55 km/h (35 mph) (10-min) 994 hPa (mbar) |
| Category 2 tropical cyclone (Australian scale) | |
| Category 1 tropical cyclone (SSHWS) | |
| Duration | 27 January – 31 January |
|---|---|
| Peak intensity | 110 km/h (70 mph) (10-min) 975 hPa (mbar) |
| Category 2 tropical cyclone (Australian scale) | |
| Tropical storm (SSHWS) | |
| Duration | 9 February – 14 February (Exited basin) |
|---|---|
| Peak intensity | 95 km/h (60 mph) (10-min) 982 hPa (mbar) |
| Category 2 tropical cyclone (Australian scale) | |
| Tropical storm (SSHWS) | |
| Duration | 9 February – 14 February |
|---|---|
| Peak intensity | 95 km/h (60 mph) (10-min) 983 hPa (mbar) |
| Tropical low (Australian scale) | |
| Duration | 1 March – 6 March |
|---|---|
| Peak intensity | 65 km/h (40 mph) (10-min) 1000 hPa (mbar) |
| Tropical low (Australian scale) | |
| Tropical storm (SSHWS) | |
| Duration | 14 March – 16 March |
|---|---|
| Peak intensity | 55 km/h (35 mph) (10-min) 998 hPa (mbar) |
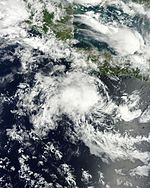
The 2015–16 Australian region cyclone season was the least active tropical cyclone season since reliable records started during 1969, with only three named tropical cyclones developing in the region. Reasons for the low activity during the year included a positive Indian Ocean Dipole occurring and the 2014–16 El Niño event. Ahead of the season starting; the Australian Bureau of Meteorology predicted that there was a 91% chance that the season would be below average. As the 2015–16 tropical cyclone year opened on 1 July 2015, the newly named Tropical Cyclone Raquel moved south-westward into the Australian region. Over the next couple of days, the system meandered around 160°E and moved through the Solomon Islands, before it was last noted on 5 July. The basin subsequently remained quiet with only several weak tropical lows developing, before the first named tropical cyclone of the season was named Stan during 29 January 2016.
Stan subsequently made landfall on Western Australia and impacted various commodities including oil, natural gas and iron ore. However, impacts were limited due to the low population of the region. The precursor tropical low to Tropical Cyclone Uriah developed over the Indian Ocean, within a monsoon trough of low pressure during 9 February. The system subsequently developed further and was named Uriah during 13 February, before it moved out of the region during the following day. Tropical Cyclone Tatiana developed into a tropical cyclone, during 11 February while it was located over the Coral Sea. Over the next few days, the system remained over water and dissipated during 15 February after it had produced some powerful, long period swells along Queensland beaches. After Tatiana dissipated four tropical lows occurred in the region before the season ended on 30 April, including the remnant tropical low of Severe Tropical Cyclone Winston.
Ahead of the cyclone season, the FMS, the BoM, Meteo France, New Zealand's MetService and National Institute of Water and Atmospheric Research (NIWA) and various other Pacific Meteorological services, all contributed towards the Island Climate Update tropical cyclone outlook that was released during October 2015. The outlook took into account the strong El Niño conditions that had been observed across the Pacific and analogue seasons that had ENSO neutral and weak El Niño conditions occurring during the season. The outlook called for an above average number of tropical cyclones for the 2015–16 season, with eleven to thirteen named tropical cyclones to occur between 135°E and 120°W compared to an average of 10-12. At least six of the tropical cyclones were expected to become category 3 severe tropical cyclones, while four could become category 4 severe tropical cyclones. It was also noted that Category 5 severe tropical cyclones, with 10-minute sustained windspeeds of 196 km/h (122 mph) were known to occur during El Nino events.
...
Wikipedia


