2014–15 Australian region cyclone season
| 2014–15 Australian region cyclone season |

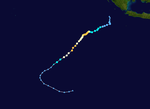
Season summary map
|
| Seasonal boundaries |
| First system formed |
3 December 2014 |
| Last system dissipated |
5 July 2015 (record latest)
|
| Strongest storm |
|
| Name |
Marcia |
| • Maximum winds |
205 km/h (125 mph)
(10-minute sustained) |
| • Lowest pressure |
930 hPa (mbar) |
| Seasonal statistics |
| Tropical lows |
17 |
| Tropical cyclones |
9 |
| Severe tropical cyclones |
7 |
| Total fatalities |
1 total |
| Total damage |
$732 million (2015 USD) |
| Related articles |
|
|
Australian region tropical cyclone seasons
2012–13, 2013–14, 2014–15, 2015–16, 2016–17
|
| Category 2 tropical cyclone (Australian scale) |
| Tropical storm (SSHWS) |
|
|
| Duration |
10 December – 13 December |
| Peak intensity |
95 km/h (60 mph) (10-min) 991 hPa (mbar) |
| Category 4 severe tropical cyclone (Australian scale) |
| Category 3 tropical cyclone (SSHWS) |
|
|
| Duration |
21 December – 30 December (Exited basin)
|
| Peak intensity |
165 km/h (105 mph) (10-min) 952 hPa (mbar) |
| Tropical low (Australian scale) |
|
|
| Duration |
2 January – 10 January |
| Peak intensity |
Winds not specified |
| Tropical low (Australian scale) |
|
|
| Duration |
10 January – 13 January |
| Peak intensity |
55 km/h (35 mph) (10-min) 998 hPa (mbar) |
| Category 4 severe tropical cyclone (Australian scale) |
| Category 3 tropical cyclone (SSHWS) |
|
|
| Duration |
12 February – 20 February |
| Peak intensity |
185 km/h (115 mph) (10-min) 943 hPa (mbar) |
| Category 5 severe tropical cyclone (Australian scale) |
| Category 4 tropical cyclone (SSHWS) |
|
|
| Duration |
15 February – 26 February |
| Peak intensity |
205 km/h (125 mph) (10-min) 930 hPa (mbar) |
| Category 3 severe tropical cyclone (Australian scale) |
| Category 2 tropical cyclone (SSHWS) |
|
|
| Duration |
8 March – 14 March |
| Peak intensity |
150 km/h (90 mph) (10-min) 960 hPa (mbar) |
| Category 4 severe tropical cyclone (Australian scale) |
| Category 2 tropical cyclone (SSHWS) |
|
|
| Duration |
9 March – 25 March |
| Peak intensity |
165 km/h (105 mph) (10-min) 963 hPa (mbar) |
| Category 4 severe tropical cyclone (Australian scale) |
| Category 3 tropical cyclone (SSHWS) |
|
|
| Duration |
6 April (Entered basin) – 8 April |
| Peak intensity |
175 km/h (110 mph) (10-min) 951 hPa (mbar) |
The 2014–15 Australian region cyclone season was a slightly below average tropical cyclone season. The season officially ran from November 1, 2014, to April 30, 2015, however, a tropical cyclone could form at any time between July 1, 2014, and June 30, 2015, and would count towards the season total. During the season, tropical cyclones were officially monitored, by one of the five Tropical Cyclone Warning Centres (TCWCs) that are operated in this region.
Three of the five centres are operated by the Australian Bureau of Meteorology (BoM) in Perth, Darwin, and Brisbane, while the other two are operated by the National Weather Service of Papua New Guinea in Port Moresby and the Indonesian Agency for Meteorology, Climatology and Geophysics in Jakarta, Indonesia. The United States Joint Typhoon Warning Center (JTWC) and other national meteorological services including Météo-France also monitored the basin during the season.
Ahead of the cyclone season, the Australian Bureau of Meteorology (BoM), the New Zealand National Institute of Water and Atmospheric Research (NIWA) and various other Pacific Meteorological services, all contributed towards the Island Climate Update tropical cyclone outlook that was released during October 2014. The outlook took into account the ENSO neutral conditions that had been observed across the Pacific and analogue seasons that had ENSO neutral and weak El Niño conditions occurring during the season. The outlook called for a near average number of tropical cyclones for the 2014–15 season, with eight to twelve named tropical cyclones, to occur between 135°E and 120°W compared to an average of 10. At least four of the tropical cyclones were expected to become category 3 severe tropical cyclones, while three could become category 4 severe tropical cyclones, they also noted that a Category 5 severe tropical cyclone was unlikely to occur.
...
Wikipedia


