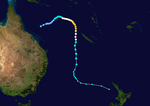
2012–13 Australian region cyclone season
| 2012–13 Australian region cyclone season |

Season summary map
|
| Seasonal boundaries |
| First system formed |
18 December 2012 |
| Last system dissipated |
2 May 2013 |
| Strongest storm |
|
| Name |
Narelle |
| • Maximum winds |
185 km/h (115 mph)
(10-minute sustained) |
| • Lowest pressure |
930 hPa (mbar) |
| Seasonal statistics |
| Tropical lows |
16 |
| Tropical cyclones |
10 |
| Severe tropical cyclones |
5 |
| Total fatalities |
20 total |
| Total damage |
$2.5 billion (2013 USD) |
| Related articles |
|
|
Australian region tropical cyclone seasons
2010–11, 2011–12, 2012–13, 2013–14, 2014–15
|
| Category 1 tropical cyclone (Australian scale) |
| Tropical storm (SSHWS) |
|
|
| Duration |
28 December – 1 January |
| Peak intensity |
75 km/h (45 mph) (10-min) 990 hPa (mbar) |
| Category 2 tropical cyclone (Australian scale) |
| Tropical storm (SSHWS) |
|
|
| Duration |
29 December (Entered basin) – 29 December (Exited basin)
|
| Peak intensity |
110 km/h (70 mph) (10-min) 976 hPa (mbar) |
| Category 4 severe tropical cyclone (Australian scale) |
| Category 4 tropical cyclone (SSHWS) |
|
|
| Duration |
5 January – 15 January |
| Peak intensity |
185 km/h (115 mph) (10-min) 930 hPa (mbar) |
| Tropical low (Australian scale) |
|
|
| Duration |
13 January – 16 January |
| Peak intensity |
Winds not specified 1003 hPa (mbar) |
| Category 1 tropical cyclone (Australian scale) |
| Tropical storm (SSHWS) |
|
|
| Duration |
17 January – 28 January |
| Peak intensity |
65 km/h (40 mph) (10-min) 991 hPa (mbar) |
| Category 1 tropical cyclone (Australian scale) |
| Tropical storm (SSHWS) |
|
|
| Duration |
20 January – 23 January |
| Peak intensity |
75 km/h (45 mph) (10-min) 992 hPa (mbar) |
| Category 4 severe tropical cyclone (Australian scale) |
| Category 3 tropical cyclone (SSHWS) |
|
|
| Duration |
18 February – 28 February |
| Peak intensity |
165 km/h (105 mph) (10-min) 945 hPa (mbar) |
| Tropical low (Australian scale) |
| Tropical storm (SSHWS) |
|
|
| Duration |
22 February – 28 February |
| Peak intensity |
55 km/h (35 mph) (10-min) 995 hPa (mbar) |
| Category 3 severe tropical cyclone (Australian scale) |
| Category 1 tropical cyclone (SSHWS) |
|
|
| Duration |
5 March – 9 March (Exited basin)
|
| Peak intensity |
120 km/h (75 mph) (10-min) 974 hPa (mbar) |
The 2012–13 Australian region cyclone season was a slightly below average tropical cyclone season event in the ongoing cycle of tropical cyclone formation. It officially started on 1 November 2012, and officially ended on 30 April 2013, despite Cyclone Zane being an active system at the time (it dissipated a day later on 1 May). The regional tropical cyclone operational plan defines a "tropical cyclone year" separately from a "tropical cyclone season"; the "tropical cyclone year" began on 1 July 2012 and ended on 30 June 2013.
The scope of the Australian region is limited to all areas south of the equator, east of 90°E and west of 160°E. This area includes Australia, Papua New Guinea, western parts of the Solomon Islands, East Timor and southern parts of Indonesia. Tropical cyclones in this area are monitored by five Tropical Cyclone Warning Centres (TCWCs): the Australian Bureau of Meteorology in Perth, Darwin, and Brisbane; TCWC Jakarta in Indonesia; and TCWC Port Moresby in Papua New Guinea. The Joint Typhoon Warning Center issues unofficial warnings for the region, designating tropical depressions with the "S" suffix when they form west of 145°E, and the "P" suffix when they form east of 145°E.
During each tropical cyclone year, Australia's Bureau of Meteorology National Climate Centre (BoM), the Guy Carpenter Asia-Pacific Climate Impact Centre, New Zealand's National Institute of Water and Atmospheric Research (NIWA) and partners issue seasonal forecasts for the Australian region and its various subregions. Since a tropical cyclone can move through a region, the actual number of tropical cyclones in a region include any that form in or move into a region from another.
...
Wikipedia


