2010–11 Australian region cyclone season
| 2010–11 Australian region cyclone season |

Season summary map
|
| Seasonal boundaries |
| First system formed |
28 October 2010 |
| Last system dissipated |
18 April 2011 |
| Strongest storm |
|
| Name |
Yasi |
| • Maximum winds |
205 km/h (125 mph)
(10-minute sustained) |
| • Lowest pressure |
929 hPa (mbar) |
| Seasonal statistics |
| Tropical lows |
28 |
| Tropical cyclones |
11 |
| Severe tropical cyclones |
5 |
| Total fatalities |
3 total |
| Total damage |
$3.62 billion (2011 USD) |
| Related articles |
|
|
Australian region tropical cyclone seasons
2008–09, 2009–10, 2010–11, 2011–12, 2012–13
|
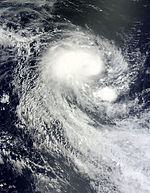
| Category 2 tropical cyclone (Australian scale) |
| Tropical storm (SSHWS) |
|
|
| Duration |
28 October – 4 November |
| Peak intensity |
95 km/h (60 mph) (10-min) 986 hPa (mbar) |
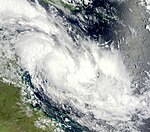
| Category 2 tropical cyclone (Australian scale) |
| Category 1 tropical cyclone (SSHWS) |
|
|
| Duration |
3 December (Entered basin) – 4 December |
| Peak intensity |
95 km/h (60 mph) (10-min) 987 hPa (mbar) |
| Tropical low (Australian scale) |
|
|
| Duration |
15 December – 20 December |
| Peak intensity |
55 km/h (35 mph) (10-min) 989 hPa (mbar) |
| Category 1 tropical cyclone (Australian scale) |
| Tropical storm (SSHWS) |
|
|
| Duration |
20 December – 25 December |
| Peak intensity |
75 km/h (45 mph) (10-min) 993 hPa (mbar) |
| Category 1 tropical cyclone (Australian scale) |
| Tropical storm (SSHWS) |
|
|
| Duration |
10 January – 15 January |
| Peak intensity |
75 km/h (45 mph) (10-min) 986 hPa (mbar) |
| Category 4 severe tropical cyclone (Australian scale) |
| Category 2 tropical cyclone (SSHWS) |
|
|
| Duration |
12 January – 16 January (Out of basin)
|
| Peak intensity |
185 km/h (115 mph) (10-min) 943 hPa (mbar) |
| Category 2 tropical cyclone (Australian scale) |
| Tropical storm (SSHWS) |
|
|
| Duration |
22 January – 31 January |
| Peak intensity |
95 km/h (60 mph) (10-min) 989 hPa (mbar) |
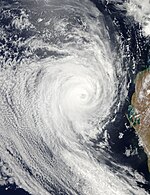
| Category 4 severe tropical cyclone (Australian scale) |
| Category 2 tropical cyclone (SSHWS) |
|
|
| Duration |
23 January – 30 January |
| Peak intensity |
165 km/h (105 mph) (10-min) 945 hPa (mbar) |
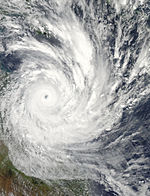
| Category 5 severe tropical cyclone (Australian scale) |
| Category 4 tropical cyclone (SSHWS) |
|
|
| Duration |
31 January (Entered basin) – 3 February |
| Peak intensity |
205 km/h (125 mph) (10-min) 929 hPa (mbar) |
The 2010–11 Australian region cyclone season was a near average tropical cyclone season, with eleven tropical cyclones forming compared to an average of 12. The season began on 1 November 2010 and ended on 30 April 2011, although the first tropical cyclone formed on 28 October. The Australian region is defined as being to the south of the equator, between the 90th meridian east and 160th meridian east. Tropical cyclones in this area are monitored by five Tropical Cyclone Warning Centres (TCWC's): Jakarta, Port Moresby, Perth, Darwin, and Brisbane, each of which have the power to name a tropical cyclone. The TCWC's in Perth, Darwin, and Brisbane are run by the Bureau of Meteorology, who designate significant tropical lows with a number and the U suffix. The Joint Typhoon Warning Center also issues unofficial warnings for the region, designating significant tropical cyclones with the "S" suffix when they form west of 135°E, and the "P" suffix when they form east of 135°E.
Ahead of the cyclone season, the Australian Bureau of Meteorology (BoM), the New Zealand National Institute of Water and Atmospheric Research (NIWA) and various other Pacific Meteorological services, all contributed towards the Island Climate Update tropical cyclone outlook that was released during October 2010. The outlook took into account the moderate-strong La Nina conditions that had been observed across the Pacific and analogue seasons that had La Nina conditions occurring during the season. The outlook called for a normal or above average number of tropical cyclone occurring during the season, with nine to twelve named tropical cyclones, to occur between 135°E and 120°W compared to an average of nine. At least three of the tropical cyclones were expected to become category 3 severe tropical cyclones, while one was expected to become a category 4 severe tropical cyclone. In addition to contributing towards the Island Climate Update outlook, the BoM issued seven seasonal forecasts during October 2010, for the Australian region and the Southern Pacific with each forecast covering the whole tropical cyclone year. Each forecast issued took into account the La Nina conditions that had developed over the region and were forecasted to persist during the season.
...
Wikipedia


