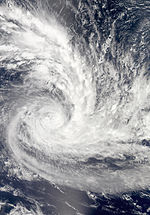
2010-11 South Pacific cyclone season
| 2010–11 South Pacific cyclone season |

Season summary map
|
| Seasonal boundaries |
| First system formed |
November 24, 2010 |
| Last system dissipated |
May 11, 2011 |
| Strongest storm |
|
| Name |
Wilma |
| • Maximum winds |
185 km/h (115 mph)
(10-minute sustained) |
| • Lowest pressure |
935 hPa (mbar) |
| Seasonal statistics |
| Total disturbances |
17 |
| Total depressions |
14 |
| Tropical cyclones |
7 |
| Severe tropical cyclones |
5 |
| Total fatalities |
3 direct, 1 indirect |
| Total damage |
$25 million (2010 USD) |
| Related articles |
|
|
South Pacific tropical cyclone seasons
2008–09, 2009–10, 2010–11, 2011–12, 2012–13
|
| Tropical depression (Australian scale) |
|
|
| Duration |
November 24 – November 30 |
| Peak intensity |
65 km/h (40 mph) (10-min) 999 hPa (mbar) |
| Category 2 tropical cyclone (Australian scale) |
| Tropical storm (SSHWS) |
|
|
| Duration |
January 5 – January 15 |
| Peak intensity |
100 km/h (65 mph) (10-min) 973 hPa (mbar) |
| Category 4 severe tropical cyclone (Australian scale) |
| Category 2 tropical cyclone (SSHWS) |
|
|
| Duration |
January 16 (Entered basin) – January 17 |
| Peak intensity |
165 km/h (105 mph) (10-min) 957 hPa (mbar) |
| Category 4 severe tropical cyclone (Australian scale) |
| Category 4 tropical cyclone (SSHWS) |
|
|
| Duration |
January 19 – January 29 |
| Peak intensity |
185 km/h (115 mph) (10-min) 935 hPa (mbar) |
| Tropical depression (Australian scale) |
|
|
| Duration |
January 20 – January 22 |
| Peak intensity |
65 km/h (40 mph) (10-min) 996 hPa (mbar) |
| Tropical depression (Australian scale) |
| Tropical storm (SSHWS) |
|
|
| Duration |
January 24 – January 25 |
| Peak intensity |
45 km/h (30 mph) (10-min) 998 hPa (mbar) |
| Category 3 severe tropical cyclone (Australian scale) |
| Category 2 tropical cyclone (SSHWS) |
|
|
| Duration |
January 26 – January 31 (Out of basin)
|
| Peak intensity |
150 km/h (90 mph) (10-min) 957 hPa (mbar) |
| Category 2 tropical cyclone (Australian scale) |
| Tropical storm (SSHWS) |
|
|
| Duration |
February 5 – February 7 |
| Peak intensity |
95 km/h (60 mph) (10-min) 985 hPa (mbar) |
| Category 4 severe tropical cyclone (Australian scale) |
| Category 4 tropical cyclone (SSHWS) |
|
|
| Duration |
February 13 – February 24 |
| Peak intensity |
165 km/h (105 mph) (10-min) 940 hPa (mbar) |
The 2010–11 South Pacific cyclone season was a slightly below average tropical cyclone season, with seven tropical cyclones and five severe tropical cyclones developing during the season. The season ran from November 1, 2010 until April 30, 2011, though if any tropical cyclones had developed between July 1, 2010 and June 30, 2011, the official tropical cyclone year, they would have been counted towards the season's total. Within the South Pacific basin tropical cyclones were officially monitored by the Fiji Meteorological Service's Regional Specialized Meteorological Center in Nadi, Fiji, north of 25°S, and to the south the Meteorological Service of New Zealand's Tropical Cyclone Warning Center in Wellington, New Zealand. Any disturbances forming in the region were designated with a sequential number suffixed by the letter F. In addition, the United States Military's Joint Typhoon Warning Center unofficially monitored parts of the basin during the season, where any systems judged to have achieved tropical storm strength or greater received a number suffixed with the letter P. RSMC Nadi and TCWC Wellington both use the Australian Tropical Cyclone Intensity Scale, and measure wind speeds over a period of ten minutes, while the JTWC measures sustained winds over a period of one minute which can be applied to the Saffir–Simpson Hurricane Scale. Seven named storms formed or moved into the South Pacific basin during the 2010–11 season, the strongest of which was Severe Tropical Cyclone Wilma in late January.
Ahead of the cyclone season, RSMC Nadi, TCWC Wellington, the Australian Bureau of Meteorology (BoM), the New Zealand National Institute of Water and Atmospheric Research (NIWA) and various other Pacific Meteorological services, all contributed towards the Island Climate Update tropical cyclone outlook that was released during October 2010. The outlook took into account the moderate-strong La Nina conditions that had been observed across the Pacific and analogue seasons that had La Nina conditions occurring during the season. The outlook called for a normal or above average number of tropical cyclone occurring during the season, with nine to twelve named tropical cyclones, to occur between 135°E and 120°W compared to an average of nine. At least three of the tropical cyclones were expected to become category 3 severe tropical cyclones, while one was expected to become a category 4 severe tropical cyclone. In addition to contributing towards the Island Climate Update outlook, RSMC Nadi and the BoM issued their own seasonal forecasts for the South Pacific region. The BoM issued 2 seasonal forecasts for the South Pacific region between 142.5°E – 165°E and one for the Eastern Southern Pacific region between 165°E – 120°W. They noted that the western region had a 79% chance of being above average activity with seven to eight tropical cyclones expected to form, compared to an average of five tropical cyclones. The eastern region had a 33% chance of being above average with five to six tropical cyclones predicted, compared to an average of seven tropical cyclones.
...
Wikipedia


