2008–09 South Pacific cyclone season
| 2008–09 South Pacific cyclone season |
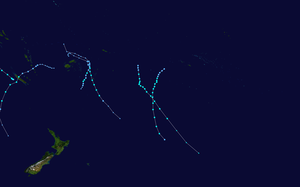
Season summary map
|
| Seasonal boundaries |
| First system formed |
December 1, 2008 |
| Last system dissipated |
April 11, 2009 |
| Strongest storm |
|
| Name |
Lin |
| • Maximum winds |
110 km/h (70 mph)
(10-minute sustained) |
| • Lowest pressure |
975 hPa (mbar) |
| Seasonal statistics |
| Total disturbances |
15 |
| Total depressions |
12 |
| Tropical cyclones |
6 |
| Severe tropical cyclones |
0 (record low, tied with 1994–95)
|
| Total fatalities |
11 |
| Total damage |
$65 million (2009 USD) |
| Related articles |
|
|
South Pacific tropical cyclone seasons
2006–07, 2007–08, 2008–09, 2009–10, 2010–11
|
| Tropical depression (Australian scale) |
|
|
| Duration |
December 3 – December 6 |
| Peak intensity |
45 km/h (30 mph) (10-min) 1004 hPa (mbar) |
| Tropical disturbance (Australian scale) |
|
|
| Duration |
December 10 – December 11 |
| Peak intensity |
35 km/h (25 mph) (10-min) 1001 hPa (mbar) |
| Tropical depression (Australian scale) |
|
|
| Duration |
January 4 – January 12 |
| Peak intensity |
65 km/h (40 mph) (10-min) 994 hPa (mbar) |
| Tropical depression (Australian scale) |
|
|
| Duration |
January 11 – January 14 |
| Peak intensity |
55 km/h (35 mph) (10-min) 999 hPa (mbar) |
| Tropical depression (Australian scale) |
|
|
| Duration |
January 19 – January 23 |
| Peak intensity |
55 km/h (35 mph) (10-min) 1005 hPa (mbar) |
| Tropical depression (Australian scale) |
|
|
| Duration |
January 23 – January 25 |
| Peak intensity |
65 km/h (40 mph) (10-min) 1006 hPa (mbar) |
| Category 1 tropical cyclone (Australian scale) |
| Tropical storm (SSHWS) |
|
|
| Duration |
January 24 – January 31 |
| Peak intensity |
65 km/h (40 mph) (10-min) 995 hPa (mbar) |
| Tropical depression (Australian scale) |
|
|
| Duration |
February 1 – February 5 |
| Peak intensity |
55 km/h (35 mph) (10-min) 998 hPa (mbar) |
| Category 1 tropical cyclone (Australian scale) |
| Tropical storm (SSHWS) |
|
|
| Duration |
February 13 – February 18 |
| Peak intensity |
75 km/h (45 mph) (10-min) 990 hPa (mbar) |
The 2008–09 South Pacific cyclone season began on December 1, 2008 with the formation of Tropical Disturbance 01F. This was 30 days after the season had officially begun on November 1, 2008. The season officially ended on April 30, 2009. Tropical cyclones that were between 160°E and 120°W and north of 25°S were monitored by the Fiji Meteorological Service. Those that moved south of 25°S were monitored by the Tropical Cyclone Warning Centre (TCWC) in Wellington, New Zealand.
During the season, there were 15 Tropical Disturbances with 12 of them intensifying into Tropical Depressions, which were monitored by the Regional Specialized Meteorological Centre in Nadi, Fiji, which is a part of the Fiji Meteorological Service. Only five of the Tropical Depressions intensified into Tropical Cyclones which were named Hettie, Innis, Joni, Ken, and Lin. Both Cyclone Innis and Cyclone Hettie had peak wind speeds of 75 km/h (45 mph) which made them Category One cyclones on the Australian Tropical Cyclone Intensity Scale, whilst Cyclone Ken had wind speeds of 95 km/h (60 mph). Cyclones Joni and Lin had peak wind speeds of 100 km/h (65 mph) and 110 km/h, (70 mph) respectively which made them Category 2 cyclones. Cyclone Jasper also moved into the region from the Australian basin at its peak wind speeds of 100 km/h (65 mph) which made it a Category Two cyclone. For the first time since the 1994-95 tropical cyclone season there were no tropical cyclones that developed into a Severe Tropical Cyclone, which have winds of at least 120 km/h (75 mph).
During September and October 2008, both RSMC Nadi and New Zealand's National Institute of Water and Atmospheric Research (NIWA) issued seasonal forecasts which contained information on how many tropical cyclones that were predicted to develop within the upcoming season. Both agencies expected that the season would see a near average amount of tropical cyclone activity within the South Pacific basin as ENSO neutral conditions were predicted to last throughout the season. As a result of these conditions, RSMC Nadi and NIWA both predicted that 5–8 tropical cyclones would exist within the basin.
...
Wikipedia


