2006–07 South Pacific cyclone season
| 2006–07 South Pacific cyclone season |

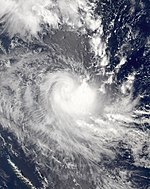
Season summary map
|
| Seasonal boundaries |
| First system formed |
October 20, 2006 |
| Last system dissipated |
April 6, 2007 |
| Strongest storm |
|
| Name |
Xavier |
| • Maximum winds |
175 km/h (110 mph)
(10-minute sustained) |
| • Lowest pressure |
930 hPa (mbar) |
| Seasonal statistics |
| Total disturbances |
15 |
| Total depressions |
12 |
| Tropical cyclones |
6 |
| Severe tropical cyclones |
2 |
| Total fatalities |
Unknown |
| Total damage |
Unknown |
| Related articles |
|
|
South Pacific tropical cyclone seasons
2004–05, 2005–06, 2006–07, 2007–08, 2008–09
|
| Category 4 severe tropical cyclone (Australian scale) |
| Category 4 tropical cyclone (SSHWS) |
|
|
| Duration |
October 20 – October 26 |
| Peak intensity |
175 km/h (110 mph) (10-min) 930 hPa (mbar) |
| Tropical depression (Australian scale) |
|
|
| Duration |
October 24 – October 29 |
| Peak intensity |
Winds not specified 1004 hPa (mbar) |
| Tropical depression (Australian scale) |
|
|
| Duration |
November 1 – November 3 |
| Peak intensity |
Winds not specified 1004 hPa (mbar) |
| Category 3 severe tropical cyclone (Australian scale) |
| Category 1 tropical cyclone (SSHWS) |
|
|
| Duration |
November 16 – November 26 |
| Peak intensity |
140 km/h (85 mph) (10-min) 960 hPa (mbar) |
| Tropical depression (Australian scale) |
| Tropical storm (SSHWS) |
|
|
| Duration |
November 29 – December 4 |
| Peak intensity |
55 km/h (35 mph) (10-min) 997 hPa (mbar) |
| Tropical depression (Australian scale) |
|
|
| Duration |
January 9 – January 17 |
| Peak intensity |
55 km/h (35 mph) (10-min) 1000 hPa (mbar) |
| Category 2 tropical cyclone (Australian scale) |
| Tropical storm (SSHWS) |
|
|
| Duration |
January 18 – January 25 |
| Peak intensity |
110 km/h (70 mph) (10-min) 975 hPa (mbar) |
| Category 2 tropical cyclone (Australian scale) |
| Category 1 tropical cyclone (SSHWS) |
|
|
| Duration |
January 21 – January 27 |
| Peak intensity |
110 km/h (70 mph) (10-min) 975 hPa (mbar) |
| Tropical depression (Australian scale) |
| Tropical storm (SSHWS) |
|
|
| Duration |
February 1 – February 5 |
| Peak intensity |
55 km/h (35 mph) (10-min) 997 hPa (mbar) |
The 2006–07 South Pacific cyclone season was an event in the annual cycle of tropical cyclone formation. It began on November 1, 2006 and ended on April 30, 2007. These dates conventionally delimit the period of each year when most tropical cyclones form in the southern Pacific Ocean east of 160°E. Additionally, the regional tropical cyclone operational plan defines a tropical cyclone year separately from a tropical cyclone season, and the "tropical cyclone year" runs from July 1, 2006 to June 30, 2007.
Tropical cyclones between 160°E and 120°W and north of 25°S are monitored by the Fiji Meteorological Service in Nadi. Those that move south of 25°S are monitored by the Tropical Cyclone Warning Centre in Wellington, New Zealand.
During September 2006, the Fiji Meteorological Service (FMS) reported that the development of a weak to moderate El Niño episode was likely which could push into the early months of 2007. As a result, the FMS predicted that the El Niño would have a significant effect on tropical cyclone frequency and distribution within the South Pacific basin and beyond during the upcoming season. They also predicted that the season could see an above average number of tropical cyclones occur, with a greater tendency for them to form near and east of the International Dateline. It was also predicted that a tropical cyclone may form during the early part of the season or during the pre season. The FMS also predicted that the island nations of Fiji, Tonga, Niue, Samoa and the Cook Islands, had a greater than normal chance of being affected by a tropical cyclone.
...
Wikipedia


