2005–06 South Pacific cyclone season
| 2005–06 South Pacific cyclone season |
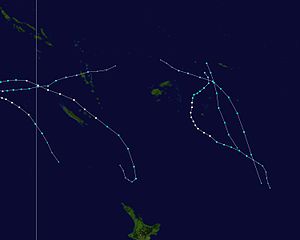
Season summary map
|
| Seasonal boundaries |
| First system formed |
November 30, 2005 |
| Last system dissipated |
April 21, 2006 |
| Strongest storm |
|
| Name |
Wati |
| • Maximum winds |
155 km/h (100 mph)
(10-minute sustained) |
| • Lowest pressure |
950 hPa (mbar) |
| Seasonal statistics |
| Total depressions |
15 |
| Tropical cyclones |
5 |
| Severe tropical cyclones |
3 |
| Total fatalities |
None Reported |
| Total damage |
$26,000 (2006 USD) |
| Related articles |
|
|
South Pacific tropical cyclone seasons
2003–04, 2004–05, 2005–06, 2006–07, 2007–08
|
| Tropical depression (Australian scale) |
|
|
| Duration |
November 30 – December 2 |
| Peak intensity |
Winds not specified 1005 hPa (mbar) |
| Tropical depression (Australian scale) |
|
|
| Duration |
December 3 – December 6 |
| Peak intensity |
Winds not specified 1002 hPa (mbar) |
| Tropical depression (Australian scale) |
|
|
| Duration |
December 8 – December 16 |
| Peak intensity |
35 km/h (25 mph) (10-min) 1001 hPa (mbar) |
| Category 1 tropical cyclone (Australian scale) |
| Tropical storm (SSHWS) |
|
|
| Duration |
January 6 – January 14 |
| Peak intensity |
85 km/h (50 mph) (10-min) 987 hPa (mbar) |
| Tropical depression (Australian scale) |
|
|
| Duration |
January 10 – January 13 |
| Peak intensity |
55 km/h (35 mph) (10-min) 996 hPa (mbar) |
| Category 2 tropical cyclone (Australian scale) |
| Tropical storm (SSHWS) |
|
|
| Duration |
January 13 – January 15 |
| Peak intensity |
110 km/h (70 mph) (10-min) 975 hPa (mbar) |
| Tropical depression (Australian scale) |
|
|
| Duration |
January 15 – January 16 |
| Peak intensity |
30 km/h (15 mph) (10-min) |
| Category 3 severe tropical cyclone (Australian scale) |
| Category 1 tropical cyclone (SSHWS) |
|
|
| Duration |
January 30 – February 3 |
| Peak intensity |
150 km/h (90 mph) (10-min) 955 hPa (mbar) |
| Tropical depression (Australian scale) |
|
|
| Duration |
January 30 – January 30 |
| Peak intensity |
Winds not specified 994 hPa (mbar) |
The 2005–06 South Pacific cyclone season was an event in the annual cycle of tropical cyclone formation. It began on November 1, 2005 and ended on April 30, 2006. These dates conventionally delimit the period of each year when most tropical cyclones form in the southern Pacific Ocean east of 160°E. Additionally, the regional tropical cyclone operational plan defines a tropical cyclone year separately from a tropical cyclone season, and the "tropical cyclone year" runs from July 1, 2005 to June 30, 2006.
Tropical cyclones between 160°E and 120°W and north of 25°S are monitored by the Fiji Meteorological Service in Nadi. Those that move south of 25°S are monitored by the Tropical Cyclone Warning Centre in Wellington, New Zealand.
During October 2005, both RSMC Nadi and New Zealand's National Institute of Water and Atmospheric Research issued seasonal forecasts which contained information on what was expected to occur during the 2005-06 tropical cyclone season. Both agencies expected that the season would see a near average amount of tropical cyclone activity due there being no El Niño or La Nina. As a result of these conditions RSMC Nadi predicted that between 7-9 tropical cyclones would develop while NIWA did not predict how many tropical cyclone there would be during the season. RSMC Nadi also reported that Fiji had a higher chance of being hit by a tropical cyclone this season than during recent previous seasons. NIWA also predicted that there was an average risk of a tropical cyclone coming within 550 km (340 mi), of: Fiji, Tonga, Niue, Vanuatu, New Caledonia, Wallis and Futuna, the Southern Cook Islands, Samoa, and New Zealand.
...
Wikipedia


