1994–95 South Pacific cyclone season
| 1994–95 South Pacific cyclone season | |
|---|---|

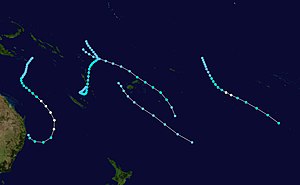
Season summary map
|
|
| Seasonal boundaries | |
| First system formed | November 12, 1994 |
| Last system dissipated | March 17, 1995 |
| Strongest storm | |
| Name | William |
| • Maximum winds | 110 km/h (70 mph) (10-minute sustained) |
| • Lowest pressure | 975 hPa (mbar) |
| Seasonal statistics | |
| Total depressions | 4 |
| Tropical cyclones | 2 |
| Severe tropical cyclones | None reported |
| Total fatalities | None reported |
| Total damage | $2.5 million (1995 USD) |
| Related articles | |
| Category 2 tropical cyclone (Australian scale) | |
| Tropical storm (SSHWS) | |
| Duration | November 10 – November 19 |
|---|---|
| Peak intensity | 100 km/h (65 mph) (10-min) 980 hPa (mbar) |
| Tropical depression (FMS) | |
| Tropical storm (SSHWS) | |
| Duration | December 13 – December 17 |
|---|---|
| Peak intensity | 65 km/h (40 mph) (1-min) 997 hPa (mbar) |
| Category 2 tropical cyclone (FMS) | |
| Category 1 tropical cyclone (SSHWS) | |
| Duration | December 30 – January 3 |
|---|---|
| Peak intensity | 110 km/h (70 mph) (10-min) 975 hPa (mbar) |
| Tropical depression (SSHWS) | |
| Duration | March 16 – March 17 |
|---|---|
| Peak intensity | 55 km/h (35 mph) (1-min) 1000 hPa (mbar) |
The 1994–95 South Pacific cyclone season was one of the least active South Pacific tropical cyclone season's on record, with only three tropical cyclones officially occurring within the South Pacific Ocean basin between 160°E and 120°W. The season ran from November 1, 1994, until April 30, 1995, with the first disturbance of the season developing on November 12 and the last disturbance dissipating on March 17. The most intense tropical cyclone during the season was Tropical Cyclone William, which affected the Cook Islands. After the season the name William was retired, from the tropical cyclone naming lists.
During the season, tropical cyclones were officially monitored by the Tropical Cyclone Warning Centers (TCWC) in Nadi, Fiji, Wellington, New Zealand and Brisbane, Australia. Throughout the season the United States Navy also monitored the basin and issued unofficial warnings, through its Joint Typhoon Warning Center (JTWC) and Naval Pacific Meteorology and Oceanography Center (NPMOC). Tropical cyclones that were located between the Equator and 25S were monitored by TCWC Nadi while any that were located to the south of 25S were monitored by TCWC Wellington. During the season the JTWC issued warnings on any tropical cyclone that was located between 160°E and 180° while the NPMOC issued warnings for tropical cyclones forming between 180° and the American coast. TCWC Nadi, Wellington and Brisbane all used the Australian Tropical Cyclone Intensity Scale, and measured windspeeds over a 10-minute period, while the JTWC and the NPMOC measured sustained windspeeds over a 1-minute period.
...
Wikipedia


