1996–97 South Pacific cyclone season
| 1996–97 South Pacific cyclone season |

Season summary map
|
| Seasonal boundaries |
| First system formed |
November 23, 1996 |
| Last system dissipated |
June 17, 1997 |
| Strongest storm |
|
| Name |
Gavin |
| • Maximum winds |
195 km/h (120 mph)
(10-minute sustained) |
| • Lowest pressure |
925 hPa (mbar) |
| Seasonal statistics |
| Total depressions |
14 |
| Tropical cyclones |
12 |
| Severe tropical cyclones |
4 |
| Total fatalities |
7 direct, 2 indirect, 18 missing |
| Total damage |
$125.91 million (1997 USD) |
| Related articles |
|
|
South Pacific tropical cyclone seasons
1994–95, 1995–96, 1996–97, 1997–98, 1998–99
|
| Category 1 tropical cyclone (Australian scale) |
| Tropical storm (SSHWS) |
|
|
| Duration |
November 23 – November 26 |
| Peak intensity |
85 km/h (50 mph) (10-min) 987 hPa (mbar) |
| Category 3 severe tropical cyclone (Australian scale) |
| Category 2 tropical cyclone (SSHWS) |
|
|
| Duration |
December 20 – December 30 |
| Peak intensity |
150 km/h (90 mph) (10-min) 955 hPa (mbar) |
| Category 4 severe tropical cyclone (Australian scale) |
| Category 4 tropical cyclone (SSHWS) |
|
|
| Duration |
January 3 – January 10 |
| Peak intensity |
165 km/h (105 mph) (10-min) 935 hPa (mbar) |
| Category 3 severe tropical cyclone (FMS) |
| Category 1 tropical cyclone (SSHWS) |
|
|
| Duration |
January 10 – January 16 |
| Peak intensity |
130 km/h (80 mph) (10-min) 965 hPa (mbar) |
| Category 2 tropical cyclone (Australian scale) |
| Category 1 tropical cyclone (SSHWS) |
|
|
| Duration |
January 26 – February 2 |
| Peak intensity |
110 km/h (70 mph) (10-min) 980 hPa (mbar) |
| Category 2 tropical cyclone (Australian scale) |
| Tropical storm (SSHWS) |
|
|
| Duration |
February 19 – February 24 |
| Peak intensity |
110 km/h (70 mph) (10-min) 975 hPa (mbar) |
| Category 2 tropical cyclone (Australian scale) |
| Tropical storm (SSHWS) |
|
|
| Duration |
February 24 – February 27 |
| Peak intensity |
110 km/h (70 mph) (10-min) 975 hPa (mbar) |
| Category 4 severe tropical cyclone (Australian scale) |
| Category 4 tropical cyclone (SSHWS) |
|
|
| Duration |
March 3 – March 12 |
| Peak intensity |
185 km/h (115 mph) (10-min) 925 hPa (mbar) |
| Category 3 severe tropical cyclone (Australian scale) |
| Category 1 tropical cyclone (SSHWS) |
|
|
| Duration |
March 12 – March 18 |
| Peak intensity |
120 km/h (75 mph) (10-min) 970 hPa (mbar) |
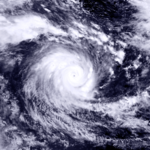
The 1996–97 South Pacific cyclone season was one of the most active and longest South Pacific tropical cyclone seasons on record, with 12 tropical cyclones occurring within the South Pacific basin between 160°E and 120°W. The season officially ran from November 1, 1996 - April 30, 1998, however, the season ended later than normal with three systems monitored after the official end of the season. The strongest tropical cyclone of the season was Cyclone Gavin which had a minimum pressure of 925 hPa (27.32 inHg). After the season had ended 4 tropical cyclone names were retired from the naming lists, after the cyclones had caused significant impacts to South Pacific islands.
During the season, tropical cyclones were officially monitored by the Regional Specialized Meteorological Center (RSMC) in Nadi, Fiji and the Tropical Cyclone Warning Centers in Brisbane, Australia and Wellington, New Zealand. The United States Armed Forces through the Joint Typhoon Warning Center (JTWC) and Naval Pacific Meteorology and Oceanography Center (NPMOC), also monitored the basin and issued unofficial warnings for American interests. During the season RSMC Nadi issued warnings and assigned names to any tropical cyclones that developed between the Equator and 25°S while TCWC Wellington issued warnings for any that were located to the south of 25°S. The JTWC issued warnings for American interests on any significant tropical cyclone that was located between 160°E and the 180° while the NPMOC issued warnings for tropical cyclones forming between 180° and the American coast. RSMC Nadi and TCWC Wellington measure sustained windspeeds over a 10-minute and used the Australian tropical cyclone intensity scale, while the JTWC and the NPMOC measured sustained windspeeds over a 1-minute period which are compared to the Saffir-Simpson Hurricane Wind Scale (SSHWS).
...
Wikipedia


