2009 Pacific typhoon season
| 2009 Pacific typhoon season |
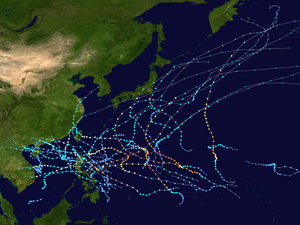
Season summary map
|
| Seasonal boundaries |
| First system formed |
January 3, 2009 |
| Last system dissipated |
December 8, 2009 |
| Strongest storm |
|
| Name |
Nida |
| • Maximum winds |
215 km/h (130 mph)
(10-minute sustained) |
| • Lowest pressure |
905 hPa (mbar) |
| Seasonal statistics |
| Total depressions |
41 |
| Total storms |
22 |
| Typhoons |
13 |
| Super typhoons |
5 (unofficial) |
| Total fatalities |
2348 |
| Total damage |
$9.97 billion (2009 USD) |
| Related articles |
|
|
Pacific typhoon seasons
2007, 2008, 2009, 2010, 2011
|
| Tropical depression (JMA) |
|
|
| Duration |
January 3 – January 6 |
| Peak intensity |
45 km/h (30 mph) (10-min) 1006 hPa (mbar) |
| Tropical depression (PAGASA) |
|
|
| Duration |
February 12 – February 13 |
| Peak intensity |
45 km/h (30 mph) (10-min) |
| Tropical depression (PAGASA) |
|
|
| Duration |
April 30 – May 1 |
| Peak intensity |
55 km/h (35 mph) (10-min) |
| Typhoon (JMA) |
| Category 4 typhoon (SSHWS) |
|
|
| Duration |
May 1 – May 7 |
| Peak intensity |
155 km/h (100 mph) (10-min) 940 hPa (mbar) |
| Typhoon (JMA) |
| Category 2 typhoon (SSHWS) |
|
|
| Duration |
May 2 – May 9 |
| Peak intensity |
120 km/h (75 mph) (10-min) 975 hPa (mbar) |
| Severe tropical storm (JMA) |
| Category 1 typhoon (SSHWS) |
|
|
| Duration |
June 14 – June 23 |
| Peak intensity |
110 km/h (70 mph) (10-min) 975 hPa (mbar) |
| Tropical storm (JMA) |
| Tropical storm (SSHWS) |
|
|
| Duration |
June 22 – June 27 |
| Peak intensity |
75 km/h (45 mph) (10-min) 994 hPa (mbar) |
| Tropical storm (JMA) |
| Tropical storm (SSHWS) |
|
|
| Duration |
July 9 – July 13 |
| Peak intensity |
65 km/h (40 mph) (10-min) 992 hPa (mbar) |
| Tropical depression (JMA) |
| Tropical depression (SSHWS) |
|
|
| Duration |
July 11 – July 14 |
| Peak intensity |
55 km/h (35 mph) (10-min) 1000 hPa (mbar) |
The 2009 Pacific typhoon season was a below average season that spawned only 22 named storms, 13 typhoons and five intense typhoons. It was also recognized as the deadliest season in the Philippines for decades. The first half of the season was very quiet whereas the second half of the season was extremely active. The season's first named storm, Kujira, developed on May 3 while the season's last named storm, Nida, dissipated on December 3.
During August, Typhoon Morakot, devastated Taiwan killing nearly 800 people and was known for the deadliest typhoon to impact the country. Typhoons Ketsana and Parma both affected the Philippines bringing extreme flooding which killed more than 600 people with damages over US$300 million from both storms. Typhoon Nida during late November reached 1-minute winds of 285 km/h (180 mph), which is the most intense in the basin since Typhoon Paka in 1997.
The scope of this article is limited to the Pacific Ocean to the north of the equator between 100°E and 180th meridian. Within the northwestern Pacific Ocean, there are two separate agencies that assign names to tropical cyclones which can often result in a cyclone having two names. The Japan Meteorological Agency (JMA) will name a tropical cyclone should it be judged to have 10-minute sustained wind speeds of at least 65 km/h (40 mph) anywhere in the basin, whilst the Philippine Atmospheric, Geophysical and Astronomical Services Administration (PAGASA) assigns names to tropical cyclones which move into or form as a tropical depression in their area of responsibility located between 135°E and 115°E and between 5°N–25°N regardless of whether or not a tropical cyclone has already been given a name by the JMA. Tropical depressions that are monitored by the United States' Joint Typhoon Warning Center (JTWC) are given a number with a "W" suffix.
...
Wikipedia


_2009_track.png)

_2009_track.png)

_2009_track.png)


