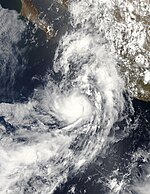
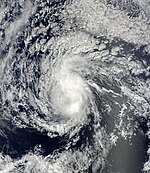
2009 Pacific hurricane season
| 2009 Pacific hurricane season |

Season summary map
|
| Seasonal boundaries |
| First system formed |
June 18, 2009 |
| Last system dissipated |
October 27, 2009 |
| Strongest storm |
|
| Name |
Rick (Third most intense hurricane in the Pacific basin)
|
| • Maximum winds |
180 mph (285 km/h)
(1-minute sustained) |
| • Lowest pressure |
906 mbar (hPa; 26.75 inHg) |
| Seasonal statistics |
| Total depressions |
23 |
| Total storms |
20 |
| Hurricanes |
8 |
Major hurricanes
(Cat. 3+) |
5 |
| Total fatalities |
10 direct, 5 indirect |
| Total damage |
$188.7 million (2009 USD) |
| Related articles |
|
|
Pacific hurricane seasons
2007, 2008, 2009, 2010, 2011
|
| Tropical depression (SSHWS) |
|
|
| Duration |
June 18 – June 19 |
| Peak intensity |
35 mph (55 km/h) (1-min) 1003 mbar (hPa) |
| Category 1 hurricane (SSHWS) |
|
|
| Duration |
June 21 – June 24 |
| Peak intensity |
80 mph (130 km/h) (1-min) 984 mbar (hPa) |
| Tropical storm (SSHWS) |
|
|
| Duration |
July 6 – July 9 |
| Peak intensity |
50 mph (85 km/h) (1-min) 998 mbar (hPa) |
| Category 2 hurricane (SSHWS) |
|
|
| Duration |
July 10 – July 16 |
| Peak intensity |
105 mph (165 km/h) (1-min) 971 mbar (hPa) |
| Tropical storm (SSHWS) |
|
|
| Duration |
July 15 – July 16 |
| Peak intensity |
60 mph (95 km/h) (1-min) 997 mbar (hPa) |
| Tropical storm (SSHWS) |
|
|
| Duration |
July 30 – August 2 |
| Peak intensity |
65 mph (100 km/h) (1-min) 995 mbar (hPa) |
| Tropical storm (SSHWS) |
|
|
| Duration |
August 3 – August 7 |
| Peak intensity |
65 mph (100 km/h) (1-min) 994 mbar (hPa) |
| Category 4 hurricane (SSHWS) |
|
|
| Duration |
August 3 – August 11 |
| Peak intensity |
145 mph (230 km/h) (1-min) 935 mbar (hPa) |
| Tropical depression (SSHWS) |
|
|
| Duration |
August 9 – August 11 |
| Peak intensity |
35 mph (55 km/h) (1-min) 1006 mbar (hPa) |
The 2009 Pacific hurricane season was the most active Pacific hurricane season since 1994. The season officially started on May 15 in the East Pacific Ocean, and on June 1 in the Central Pacific; they both ended on November 30. These dates conventionally delimit the period of each year when most tropical cyclones form in the Pacific basin. However, the formation of tropical cyclones is possible at any time of the year.
For the first time in ten years, no tropical depressions formed during the month of May. This inactivity continued into the early part of June and was the least active since 1994. The first named storm of the season did not develop until June 21, marking the latest start to a Pacific hurricane season in 40 years. However, according to the NHC's tropical weather summary, August 2009, with seven named storms in their region, was one of the most active Augusts on record for the basin. This level of activity had rarely occurred, if at all, in the past 41 years, since 1968, when the most active August on record for the region with eight named storms occurred. When Hurricane Rick reached Category 5 strength on October 17, 2009, it became the first Category 5 Eastern Pacific hurricane since Ioke in 2006, and the third-strongest Pacific hurricane on record, behind 2015's Patricia and 1997's Linda. The first Central Pacific name to be used was Lana, when it crossed into the region from the Eastern Pacific. With the naming of Tropical Storm Maka on August 11, this season became the first in seven years to use multiple Central Pacific names.
On May 21, 2009, NOAA released their forecast for the 2009 Eastern Pacific and Central Pacific hurricane seasons. They predicted a below-normal level of activity in the Eastern Pacific, with 13 to 18 named storms, of which 6 to 10 were expected to become hurricanes, and 2 to 5 expected to become major hurricanes. The forecast was based on the dissipation of a La Niña in April 2009. Sea surface temperatures were near normal around the equator makes the season an ENSO-neutral. Additionally, an El Niño was forecast to develop during the latter part of the season. Depending on the intensity of the El Niño, forecasters were unsure of whether or not it would have an effect on the overall activity in the basin. However, due to the low-activity cycle that began in 1995, the El Niño only brought the activity to a slightly above normal season.
...
Wikipedia


