2010 Pacific hurricane season
| 2010 Pacific hurricane season |
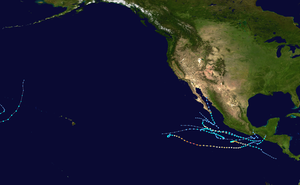
Season summary map
|
| Seasonal boundaries |
| First system formed |
May 29, 2010 |
| Last system dissipated |
December 21, 2010 |
| Strongest storm |
|
| Name |
Celia |
| • Maximum winds |
160 mph (260 km/h)
(1-minute sustained) |
| • Lowest pressure |
921 mbar (hPa; 27.2 inHg) |
| Seasonal statistics |
| Total depressions |
13 |
| Total storms |
8 (record low, tied with 1977)
|
| Hurricanes |
3 (record low)
|
Major hurricanes
(Cat. 3+) |
2 |
| Total fatalities |
268 total |
| Total damage |
$1.62 billion (2010 USD) |
| Related articles |
|
|
Pacific hurricane seasons
2008, 2009, 2010, 2011, 2012
|
| Tropical storm (SSHWS) |
|
|
| Duration |
May 29 – May 30 |
| Peak intensity |
45 mph (75 km/h) (1-min) 1001 mbar (hPa) |
| Tropical depression (SSHWS) |
|
|
| Duration |
June 16 – June 17 |
| Peak intensity |
35 mph (55 km/h) (1-min) 1007 mbar (hPa) |
| Tropical storm (SSHWS) |
|
|
| Duration |
June 17 – June 21 |
| Peak intensity |
65 mph (100 km/h) (1-min) 994 mbar (hPa) |
| Category 5 hurricane (SSHWS) |
|
|
| Duration |
June 18 – June 28 |
| Peak intensity |
160 mph (260 km/h) (1-min) 921 mbar (hPa) |
| Category 3 hurricane (SSHWS) |
|
|
| Duration |
June 23 – June 28 |
| Peak intensity |
120 mph (195 km/h) (1-min) 959 mbar (hPa) |
| Tropical depression (SSHWS) |
|
|
| Duration |
July 14 – July 16 |
| Peak intensity |
35 mph (55 km/h) (1-min) 1006 mbar (hPa) |
| Tropical storm (SSHWS) |
|
|
| Duration |
August 6 – August 10 |
| Peak intensity |
65 mph (100 km/h) (1-min) 994 mbar (hPa) |
| Tropical depression (SSHWS) |
|
|
| Duration |
August 20 – August 21 |
| Peak intensity |
35 mph (55 km/h) (1-min) 1003 mbar (hPa) |
| Category 1 hurricane (SSHWS) |
|
|
| Duration |
August 21 – August 28 |
| Peak intensity |
90 mph (150 km/h) (1-min) 978 mbar (hPa) |
The 2010 Pacific hurricane season is the least active Pacific hurricane season, alongside 1977, since reliable records began in 1971. It officially started on May 15, 2010 for the eastern Pacific, and June 1, 2010 for the central Pacific, and officially ended on November 30, 2010. Unlike the 2009 season, the first storm of the 2010 season, Agatha, formed during the month of May. It developed on May 29 near the coast of Guatemala. In the second week of June, a sudden spree of tropical cyclones developed, and between June 16 and 22, four cyclones formed, including the two major hurricanes of the season, Celia and Darby, the first of which reached Category 5 intensity. However, following the record active June, July saw zero named storms. In August and September only 2 tropical storms and one hurricane formed. Tropical Depression Eleven-E caused a great deal of flooding in southern Mexico, causing millions of dollars in damage and causing over 50 deaths and $500 million in damage in areas of Oaxaca and Guatemala. Tropical Storm Omeka was a rare off-season storm.
On May 19, 2010, the National Oceanic and Atmospheric Administration (NOAA) released their forecast for the 2010 Central Pacific hurricane season, which would start on June 1. They expected two or three cyclones to form in or enter the region throughout the season, below the average of four or five storms. The below-average activity forecast was based on two factors: the first was the continuance of a period of decreased activity in the central Pacific; and second, the effects of a Neutral El Niño-Southern Oscillation (ENSO) or La Niña, both of which reduce cyclone activity in the region. However, in light of the near-miss of Hurricane Felicia the previous year, forecasters at the Central Pacific Hurricane Center gave the public a basic message for the 2010 season, "Prepare! Watch! Act!".
...
Wikipedia


