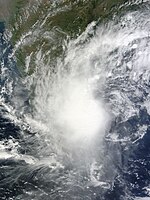
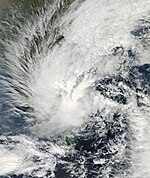
2010 North Indian Ocean cyclone season
| 2010 North Indian Ocean cyclone season | |
|---|---|

Season summary map
|
|
| Seasonal boundaries | |
| First system formed | May 17, 2010 |
| Last system dissipated | December 8, 2010 |
| Strongest storm | |
| Name | Giri |
| • Maximum winds | 195 km/h (120 mph) (3-minute sustained) |
| • Lowest pressure | 950 hPa (mbar) |
| Seasonal statistics | |
| Depressions | 8 |
| Deep depressions | 6 |
| Cyclonic storms | 5 |
| Severe cyclonic storms | 4 |
| Very severe cyclonic storms | 2 |
| Super cyclonic storms | 0 |
| ACE Index | 31.56 units |
| Total fatalities | 402 total |
| Total damage | At least $2.985 billion (2010 USD) |
| Related articles | |
| Severe cyclonic storm (IMD) | |
| Category 1 tropical cyclone (SSHWS) | |
| Duration | May 17 – May 21 |
|---|---|
| Peak intensity | 100 km/h (65 mph) (3-min) 986 hPa (mbar) |
| Cyclonic storm (IMD) | |
| Tropical storm (SSHWS) | |
| Duration | May 19 – May 23 |
|---|---|
| Peak intensity | 75 km/h (45 mph) (3-min) 994 hPa (mbar) |
| Very severe cyclonic storm (IMD) | |
| Category 4 tropical cyclone (SSHWS) | |
| Duration | May 30 – June 7 |
|---|---|
| Peak intensity | 155 km/h (100 mph) (3-min) 964 hPa (mbar) |
| Depression (IMD) | |
| Duration | October 7 – October 9 |
|---|---|
| Peak intensity | 45 km/h (30 mph) (3-min) 996 hPa (mbar) |
| Deep depression (IMD) | |
| Duration | October 13 – October 16 |
|---|---|
| Peak intensity | 55 km/h (35 mph) (3-min) 995 hPa (mbar) |
| Extremely severe cyclonic storm (IMD) | |
| Category 4 tropical cyclone (SSHWS) | |
| Duration | October 20 – October 23 |
|---|---|
| Peak intensity | 195 km/h (120 mph) (3-min) 950 hPa (mbar) |
| Severe cyclonic storm (IMD) | |
| Tropical storm (SSHWS) | |
| Duration | November 1 – November 8 |
|---|---|
| Peak intensity | 110 km/h (70 mph) (3-min) 988 hPa (mbar) |
| Depression (IMD) | |
| Duration | December 7 – December 8 |
|---|---|
| Peak intensity | 45 km/h (30 mph) (3-min) 1000 hPa (mbar) |
The 2010 North Indian Ocean cyclone season was the most intense tropical cyclone season in the North Indian Ocean since the 1998 North Indian Ocean cyclone season. It had 8 depressions and 5 named storms forming in the region.
The official Regional Specialized Meteorological Centre in this basin is the India Meteorological Department (IMD), while the Joint Typhoon Warning Center releases unofficial advisories to the Indian Ocean in the Northern Hemisphere, east of the Horn of Africa and west of the Malay Peninsula. There are two main seas in the North Indian Ocean — the Arabian Sea to the west of the Indian subcontinent, abbreviated ARB and the Bay of Bengal to the east, abbreviated BOB by the IMD.
The Season officially started on May 17, 2010 with Cyclone Laila and ended on December 8, 2010. During the season, the cyclones Laila, Phet, Giri and Jal along with Bandu caused excessive life loss across the Indian Subcontinent and the Middle east.
This is the only season to have 5 named storms since the 1998 North Indian Ocean cyclone season. Multiple storms together killed some 402 people wreaking damage worth at least US$2.985 billion. Albeit very active, no tropical storms formed between mid June and early October because of a very strong Southwest monsoon, a weather anomaly that caused the 2010 Pakistan floods.
...
Wikipedia


