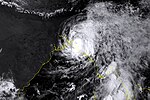
1998 North Indian Ocean cyclone season
| 1998 North Indian Ocean cyclone season |

Season summary map
|
| Seasonal boundaries |
| First system formed |
May 17, 1998 |
| Last system dissipated |
December 17, 1998 |
| Strongest storm |
|
| Name |
03A |
| • Maximum winds |
195 km/h (120 mph)
(1-minute sustained) |
| • Lowest pressure |
958 hPa (mbar) |
| Seasonal statistics |
| Depressions |
13 |
| Deep depressions |
10 |
| Cyclonic storms |
6 |
| Severe cyclonic storms |
5 |
| Very severe cyclonic storms |
3 |
| Total fatalities |
≥10,212 direct, 12 indirect, >4,353 missing |
| Total damage |
At least $3 billion (1998 USD) |
| Related articles |
|
|
North Indian Ocean tropical cyclone seasons
1996, 1997, 1998, 1999, 2000
|
| Severe cyclonic storm (IMD) |
| Category 1 tropical cyclone (SSHWS) |
|
|
| Duration |
May 17 – May 20 |
| Peak intensity |
110 km/h (70 mph) (3-min) 972 hPa (mbar) |
| Depression (IMD) |
| Tropical storm (SSHWS) |
|
|
| Duration |
May 28 – May 29 |
| Peak intensity |
45 km/h (30 mph) (3-min) 997 hPa (mbar) |
| Extremely severe cyclonic storm (IMD) |
| Category 3 tropical cyclone (SSHWS) |
|
|
| Duration |
June 4 – June 10 |
| Peak intensity |
165 km/h (105 mph) (3-min) 958 hPa (mbar) |
| Deep depression (IMD) |
|
|
| Duration |
June 13 – June 15 |
| Peak intensity |
55 km/h (35 mph) (3-min) 992 hPa (mbar) |
| Depression (IMD) |
| Tropical storm (SSHWS) |
|
|
| Duration |
September 30 – October 1 |
| Peak intensity |
45 km/h (30 mph) (3-min) 997 hPa (mbar) |
| Deep depression (IMD) |
|
|
| Duration |
October 6 – October 9 |
| Peak intensity |
55 km/h (35 mph) (3-min) 998 hPa (mbar) |
| Deep depression (IMD) |
|
|
| Duration |
October 13 – October 15 |
| Peak intensity |
55 km/h (35 mph) (3-min) 998 hPa (mbar) |
| Cyclonic Storm (IMD) |
| Tropical storm (SSHWS) |
|
|
| Duration |
October 11 – October 18 |
| Peak intensity |
65 km/h (40 mph) (3-min) 996 hPa (mbar) |
| Deep depression (IMD) |
|
|
| Duration |
October 26 – October 29 |
| Peak intensity |
55 km/h (35 mph) (3-min) 1002 hPa (mbar) |
The 1998 North Indian Ocean cyclone season was an active season in annual cycle of tropical cyclone formation. The season has no official bounds but cyclones tend to form between April and December. These dates conventionally delimit the period of each year when most tropical cyclones form in the northern Indian Ocean. There are two main seas in the North Indian Ocean—the Bay of Bengal to the east of the Indian subcontinent and the Arabian Sea to the west of India. The official Regional Specialized Meteorological Centre in this basin is the India Meteorological Department (IMD), while the Joint Typhoon Warning Center releases unofficial advisories. An average of four to six storms form in the North Indian Ocean every season with peaks in May and November. Cyclones occurring between the meridans 45°E and 100°E are included in the season by the IMD.
With eleven depressions and eight tropical cyclones, this was one of the most active seasons in the ocean along with 1987, 1996, and 2005. The season caused a large loss of life, most of which was from one storm. Over 10,000 people were killed in India when Tropical Cyclone 03A brought a 4.9-metre (16 ft) storm surge to the Kathiawar Peninsula, inundating numerous salt mines. Total damages from the storm amounted to Rs. 120 billion (US$3 billion). Tropical Cyclone 01B killed at least 26 people and left at least 4,000 fishermen missing in eastern Bangladesh on May 20. A short lived depression in mid-October killed 122 people after triggering severe flooding in Andhra Pradesh. In November, Tropical Cyclone 06B killed six people and caused property damage worth BTN 880 million (US$20.7 million) in eastern India. An additional 40 people were killed and 100 fishermen were listed as missing after Tropical Cyclone 07B affected Bangladesh.
...
Wikipedia


