2005 North Indian Ocean cyclone season
| 2005 North Indian Ocean cyclone season | |
|---|---|

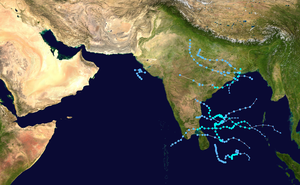
Season summary map
|
|
| Seasonal boundaries | |
| First system formed | January 7, 2005 |
| Last system dissipated | December 22, 2005 |
| Strongest storm | |
| Name | Pyarr |
| • Maximum winds | 65 km/h (40 mph) (3-minute sustained) |
| • Lowest pressure | 988 hPa (mbar) |
| Seasonal statistics | |
| Depressions | 12 official, 2 unofficial |
| Deep depressions | 7 official, 1 unofficial |
| Cyclonic storms | 3 official, 1 unofficial |
| Total fatalities | At least 273 total |
| Total damage | At least $21.4 million (2005 USD) |
| Related articles | |
| Cyclonic storm (IMD) | |
| Tropical storm (SSHWS) | |
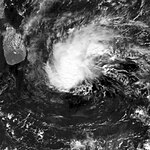
| Duration | January 13 – January 17 |
|---|---|
| Peak intensity | 65 km/h (40 mph) (3-min) 1000 hPa (mbar) |
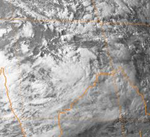
| Depression (IMD) | |
| Duration | June 27 – July 5 |
|---|---|
| Peak intensity | 45 km/h (30 mph) (3-min) 990 hPa (mbar) |
| Cyclonic storm (IMD) | |
| Tropical storm (SSHWS) | |
| Duration | September 17 – September 21 |
|---|---|
| Peak intensity | 65 km/h (40 mph) (3-min) 988 hPa (mbar) |
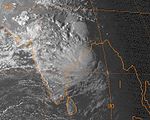
| Deep depression (IMD) | |
| Tropical storm (SSHWS) | |
| Duration | October 26 – October 29 |
|---|---|
| Peak intensity | 55 km/h (35 mph) (3-min) 998 hPa (mbar) |
| Cyclonic storm (IMD) | |
| Tropical storm (SSHWS) | |
| Duration | November 28 – December 2 |
|---|---|
| Peak intensity | 85 km/h (50 mph) (3-min) 998 hPa (mbar) |
| Cyclonic storm (IMD) | |
| Tropical storm (SSHWS) | |
| Duration | December 6 – December 10 |
|---|---|
| Peak intensity | 85 km/h (50 mph) (3-min) 998 hPa (mbar) |
| Deep depression (IMD) | |
| Tropical storm (SSHWS) | |
| Duration | December 15 – December 22 |
|---|---|
| Peak intensity | 55 km/h (35 mph) (3-min) 1000 hPa (mbar) |
The 2005 North Indian Ocean cyclone season was destructive and deadly to southern India, although most storms were weak. The basin covers the Indian Ocean north of the equator as well as inland areas, sub-divided by the Arabian Sea and the Bay of Bengal. Although the season began early with two systems in January, the bulk of activity was confined from September to December. The official India Meteorological Department tracked 12 depressions in the basin, and the unofficial Joint Typhoon Warning Center (JTWC) monitored two additional storms. Three systems intensified into a cyclonic storm, which have sustained winds of at least 63 km/h (39 mph), at which point the IMD named them.
The first official storm of the season was Cyclonic Storm Hibaru, which formed southeast of Sri Lanka in January. After nearly five months of inactivity, two depressions formed toward the end of June on opposite sides of India. The depression in the Arabian Sea was one of only two in that body of water during the year, the other of which formed in September and killed 13 people. The other was a depression that formed over land and killed 26 people in Madhya Pradesh, followed by another depression in July that killed one person. A series of deadly storms affected southeastern India beginning in September; a depression killed six people in Madhya Pradesh, Cyclonic Storm Pyarr killed 80 people, an unclassified tropical storm killed 16 people in nearby Bangladesh, and a deep depression in October killed 100 people in Andhra Pradesh. December was active, with cyclonic storms Baaz and Fanoos hitting southern India, resulting in 11 fatalities, and a deep depression remaining over waters in the middle of the month.
During the season, the India Meteorological Department (IMD) tracked cyclonic disturbances in the region, as part of them being the designated Regional Specialized Meteorological Center, covering the waters north of the Indian Ocean north of the equator from 45° E to 100° E. The activity was separated between the Bay of Bengal and the Arabian Sea, although there were no cyclonic storms in the latter region. The tropical systems were tracked using satellite imagery and the Dvorak technique, while forecasts were based on cyclone models. There were a total of 12 depressions during the year, three less than normal, although the highest since 1992. The IMD named four cyclonic storms, a process they initiated in 2004, which was also below normal. No systems strengthened beyond cyclonic storm status.
...
Wikipedia


