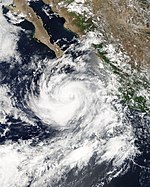
2005 Pacific hurricane season
| 2005 Pacific hurricane season | |
|---|---|

Season summary map
|
|
| Seasonal boundaries | |
| First system formed | May 17, 2005 |
| Last system dissipated | October 20, 2005 |
| Strongest storm | |
| Name | Hurricane Kenneth |
| • Maximum winds | 130 mph (215 km/h) (1-minute sustained) |
| • Lowest pressure | 947 mbar (hPa; 27.97 inHg) |
| Seasonal statistics | |
| Total depressions | 17 |
| Total storms | 15 |
| Hurricanes | 7 |
| Major hurricanes (Cat. 3+) |
2 |
| Total fatalities | 7 |
| Total damage | $12 million (2005 USD) |
| Related articles | |
| Category 1 hurricane (SSHWS) | |
| Duration | May 17 – May 21 |
|---|---|
| Peak intensity | 80 mph (130 km/h) (1-min) 982 mbar (hPa) |
| Tropical storm (SSHWS) | |
| Duration | June 21 – June 24 |
|---|---|
| Peak intensity | 50 mph (85 km/h) (1-min) 1000 mbar (hPa) |
| Tropical storm (SSHWS) | |
| Duration | June 26 – June 29 |
|---|---|
| Peak intensity | 50 mph (85 km/h) (1-min) 1000 mbar (hPa) |
| Tropical storm (SSHWS) | |
| Duration | July 4 – July 6 |
|---|---|
| Peak intensity | 45 mph (75 km/h) (1-min) 1002 mbar (hPa) |
| Tropical storm (SSHWS) | |
| Duration | July 18 – July 20 |
|---|---|
| Peak intensity | 70 mph (110 km/h) (1-min) 989 mbar (hPa) |
| Tropical depression (SSHWS) | |
| Duration | August 3 – August 5 |
|---|---|
| Peak intensity | 30 mph (45 km/h) (1-min) 1008 mbar (hPa) |
| Category 1 hurricane (SSHWS) | |
| Duration | August 9 – August 16 |
|---|---|
| Peak intensity | 85 mph (140 km/h) (1-min) 978 mbar (hPa) |
| Tropical storm (SSHWS) | |
| Duration | August 11 – August 15 |
|---|---|
| Peak intensity | 50 mph (85 km/h) (1-min) 1000 mbar (hPa) |
| Category 2 hurricane (SSHWS) | |
| Duration | August 19 – August 25 |
|---|---|
| Peak intensity | 105 mph (165 km/h) (1-min) 970 mbar (hPa) |
The 2005 Pacific hurricane season was a near average season that produce 17 depressions, 15 named storms, 7 hurricanes and 2 major hurricanes. The season officially begin on May 15, 2005 in the eastern Pacific and on June 1, 2005 in the central Pacific, and lasted until November 30, 2005. These dates conventionally delimit the period of each year when most tropical cyclones form in the northeastern Pacific Ocean. The season got off to a quick start, with the tropical depression that would become Hurricane Adrian forming just two days into the season on May 17. It took a very rare track skirting El Salvador as a Category 1 hurricane then striking Honduras as a tropical depression, where it killed seven. Between June and September, Dora was the only storm that posed a significant threat to land as it skirted the Mexican coast, and Kenneth came close to Hawaii as a dissipating tropical depression. Hurricane Otis appeared to be heading for an encounter with the Baja California peninsula, but turned north-northwest, paralleling the coast, before dissipating.
The U.S. National Oceanic and Atmospheric Administration predicted a slow year, with only a 10% chance of above-average storm activity in the eastern North Pacific and a 70% chance of below-normal activity. The pre-season forecast predicted 11 to 15 tropical storms, 6 to 8 hurricanes, and 2 to 4 major hurricanes (Category 3 or higher on the Saffir-Simpson Hurricane Scale).
The forecast for the central North Pacific was for a below-average season, with only two or three storms impacting the region, below the normal four to five.
In early May 2005, several areas of disturbed weather interacting with a weak tropical wave. This led to further development of convection around the storm. The low gradually became better organized and was determined to have become a tropical depression on the afternoon of May 17. An unusually strong mid to upper-level trough was situated over southwestern Mexico, leading to the depression traveling towards the northeast, rather than the usual northwest movement. The depression quickly intensified and became Tropical Storm Adrian later that day. Due to moderate southwesterly wind shear, Adrian only gradually intensified. By May 19, Adrian briefly intensified into a hurricane and peaked as an 80 mph (130 km/h) Category 1 hurricane shortly thereafter. Operationally, Adrian was assessed to have made landfall in El Salvador as a minimal hurricane. However, post season analysis indicated that Adrian rapidly weakened to a tropical depression before landfall near the Gulf of Fonseca in Honduras on May 20. The storm dissipated shortly after moving inland.
...
Wikipedia


