2006 Pacific hurricane season
| 2006 Pacific hurricane season |

Season summary map
|
| Seasonal boundaries |
| First system formed |
May 27, 2006 |
| Last system dissipated |
November 20, 2006 |
| Strongest storm |
|
| Name |
Ioke (Most intense hurricane in the Central Pacific)
|
| • Maximum winds |
160 mph (260 km/h)
(1-minute sustained) |
| • Lowest pressure |
915 mbar (hPa; 27.02 inHg) |
| Seasonal statistics |
| Total depressions |
25 |
| Total storms |
19 |
| Hurricanes |
11 |
Major hurricanes
(Cat. 3+) |
6 |
| Total fatalities |
14 total |
| Total damage |
$355.1 million (2006 USD) |
| Related articles |
|
|
Pacific hurricane seasons
2004, 2005, 2006, 2007, 2008
|
| Tropical storm (SSHWS) |
|
|
| Duration |
May 27 – May 30 |
| Peak intensity |
45 mph (75 km/h) (1-min) 1002 mbar (hPa) |
| Tropical depression (SSHWS) |
|
|
| Duration |
June 3 – June 5 |
| Peak intensity |
35 mph (55 km/h) (1-min) 1005 mbar (hPa) |
| Category 3 hurricane (SSHWS) |
|
|
| Duration |
July 11 – July 16 |
| Peak intensity |
125 mph (205 km/h) (1-min) 953 mbar (hPa) |
| Category 1 hurricane (SSHWS) |
|
|
| Duration |
July 12 – July 16 |
| Peak intensity |
85 mph (140 km/h) (1-min) 981 mbar (hPa) |
| Category 4 hurricane (SSHWS) |
|
|
| Duration |
July 16 – July 26 |
| Peak intensity |
150 mph (240 km/h) (1-min) 933 mbar (hPa) |
| Tropical storm (SSHWS) |
|
|
| Duration |
July 21 – July 28 |
| Peak intensity |
65 mph (100 km/h) (1-min) 990 mbar (hPa) |
| Tropical storm (SSHWS) |
|
|
| Duration |
July 31 – August 3 |
| Peak intensity |
50 mph (85 km/h) (1-min) 1000 mbar (hPa) |
| Tropical storm (SSHWS) |
|
|
| Duration |
August 1 – August 3 |
| Peak intensity |
40 mph (65 km/h) (1-min) 1004 mbar (hPa) |
| Category 2 hurricane (SSHWS) |
|
|
| Duration |
August 15 – August 23 |
| Peak intensity |
110 mph (175 km/h) (1-min) 966 mbar (hPa) |
The 2006 Pacific hurricane season was the most active since 2000, which also produced 19 tropical storms or hurricanes. Eighteen developed within the National Hurricane Center (NHC) area of warning responsibility, which is east of 140°W, and one storm formed between 140°W and the International Date Line, which is under the jurisdiction of the Central Pacific Hurricane Center (CPHC). Of the 19 total storms, eleven became hurricanes, of which six attained major hurricane status. Within the NHC portion of the basin, the season officially began on May 15, and in the CPHC portion, it started on June 1; the season officially ended on November 30. These dates conventionally delimit the period of each year when most tropical cyclones form in the eastern Pacific basin.
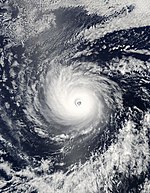
The strongest storm of the season was Hurricane Ioke, which reached Category 5 status on the Saffir-Simpson scale in the central Pacific Ocean; Ioke passed near Johnston Atoll and later Wake Island, where it caused heavy damage but no deaths. The deadliest storm of the season was Hurricane John, which killed six people after striking the Baja California Peninsula, and the costliest storm was Hurricane Lane, which caused $203 million in damage in southwestern Mexico (2006 USD, $241 million 2017 USD).
Seasonal activity began on May 27 when Tropical Storm Aletta formed off the southwest coast of Mexico. No storms formed in June, though the season became active in July when five named storms developed, including Hurricane Daniel which was the second strongest storm of the season, as well as Tropical Storm Emilia. During August, Hurricanes Ioke and John formed, as well as four other storms. September was a relatively quiet month with two storms, of which one was Hurricane Lane. Three storms developed in October including Hurricane Paul and two formed in November; this marked the second time on record, after 1961, when more than one tropical storm developed in the basin during the month of November.
...
Wikipedia


