1994 Pacific hurricane season
| 1994 Pacific hurricane season | |
|---|---|

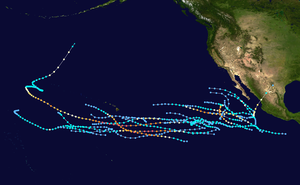
Season summary map
|
|
| Seasonal boundaries | |
| First system formed | June 18, 1994 |
| Last system dissipated | October 26, 1994 |
| Strongest storm | |
| Name | Gilma |
| • Maximum winds | 160 mph (260 km/h) (1-minute sustained) |
| • Lowest pressure | 920 mbar (hPa; 27.17 inHg) |
| Seasonal statistics | |
| Total depressions | 22 official, 1 unofficial |
| Total storms | 20 |
| Hurricanes | 10 |
| Major hurricanes (Cat. 3+) |
5 |
| Total fatalities | 4 direct, 8 missing, 22 related |
| Total damage | $735 million (1994 USD) |
| Related articles | |
| Tropical storm (SSHWS) | |
| Duration | June 18 – June 23 |
|---|---|
| Peak intensity | 50 mph (85 km/h) (1-min) 999 mbar (hPa) |
| Tropical storm (SSHWS) | |
| Duration | June 27 – June 29 |
|---|---|
| Peak intensity | 45 mph (75 km/h) (1-min) 1003 mbar (hPa) |
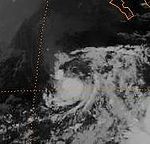
| Category 2 hurricane (SSHWS) | |
| Duration | June 28 – July 5 |
|---|---|
| Peak intensity | 105 mph (165 km/h) (1-min) 967 mbar (hPa) |
| Tropical storm (SSHWS) | |
| Duration | July 8 – July 14 |
|---|---|
| Peak intensity | 65 mph (100 km/h) (1-min) 993 mbar (hPa) |
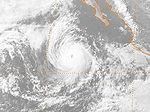
| Category 5 hurricane (SSHWS) | |
| Duration | July 16 – July 25 |
|---|---|
| Peak intensity | 160 mph (260 km/h) (1-min) 926 mbar (hPa) |
| Tropical storm (SSHWS) | |
| Duration | July 19 – July 24 |
|---|---|
| Peak intensity | 45 mph (75 km/h) (1-min) 1002 mbar (hPa) |
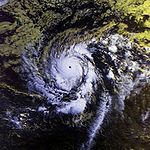
| Category 5 hurricane (SSHWS) | |
| Duration | July 21 – July 31 |
|---|---|
| Peak intensity | 160 mph (260 km/h) (1-min) 920 mbar (hPa) |
| Category 1 hurricane (SSHWS) | |
| Duration | July 31 – August 12 (Exited basin) |
|---|---|
| Peak intensity | 75 mph (120 km/h) (1-min) ≤ 1007 mbar (hPa) |
| Tropical storm (SSHWS) | |
| Duration | August 7 – August 10 |
|---|---|
| Peak intensity | 65 mph (100 km/h) (1-min) 993 mbar (hPa) |
The 1994 Pacific hurricane season was the final season of the eastern north Pacific's most recent active string of hurricane seasons that unofficially started in 1981. The season officially started on May 15, 1994, in the eastern Pacific, and on June 1, 1994, in the central Pacific, and lasted until November 30, 1994. These dates conventionally delimit the period of each year when most tropical cyclones form in the northeastern Pacific Ocean. The first tropical cyclone formed on June 18, while the last system dissipated on October 26. This season, twenty-two tropical cyclones formed in the north Pacific Ocean east of the dateline, with all but two becoming tropical storms or hurricanes. A total of 10 hurricanes occurred, including five major hurricanes.
Of note in this season is an unusual spree of very intense storms. Hurricanes Emilia, Gilma, John, and Olivia all reached a pressure below 930 millibars. Longevity-wise, no tropical cyclone of any basin had previously persisted for as long as Hurricane John, which lasted 31 days. Elsewhere, Hurricane Rosa caused four casualties in Mexico as the basin's lone landfalling tropical storm or hurricane, and later was responsible for flooding in Texas.
This season, twenty-two tropical cyclones formed in the north Pacific Ocean east of the dateline. All but two of them became tropical storms or hurricanes. In the Eastern Pacific region (140°W to North America), nineteen tropical depressions formed, of which seventeen became tropical storms, nine further intensifying into hurricanes, and five ultimately reaching major hurricanes of Category 3 intensity or higher on the Saffir Simpson Scale. These numbers are slightly above the long-term averages of fifteen tropical storms, nine hurricanes, and four major hurricanes.
In the Central Pacific Hurricane Center's area of responsibility (140°W to the International Date Line), three depressions, two tropical storms, and one hurricane formed. Overall, there were eleven tropical cyclones, eight tropical storms, five hurricanes, and three major hurricanes that formed or entered the Central Pacific region. These numbers are well above the long-term average of four tropical cyclones, two hurricanes, one tropical storm, and two depressions. The exceptionally high activity was contributed to by an El Niño ongoing at the time.
...
Wikipedia


