1997 Pacific typhoon season
| 1997 Pacific typhoon season | |
|---|---|

Season summary map
|
|
| Seasonal boundaries | |
| First system formed | January 19, 1997 |
| Last system dissipated | December 23, 1997 |
| Strongest storm | |
| Name | Ivan and Joan |
| • Maximum winds | 195 km/h (120 mph) (10-minute sustained) |
| • Lowest pressure | 905 hPa (mbar) |
| Seasonal statistics | |
| Total depressions | 47 |
| Total storms | 28 |
| Typhoons | 16 |
| Super typhoons | 11 (record high; tied with 1965) |
| Total fatalities | At least 4,181 |
| Total damage | > $4.59 billion (1997 USD) |
| Related articles | |
| Tropical depression (JMA) | |
| Tropical storm (SSHWS) | |
| Duration | January 19 – January 24 |
|---|---|
| Peak intensity | 55 km/h (35 mph) (10-min) 1002 hPa (mbar) |
| Typhoon (JMA) | |
| Category 5 super typhoon (SSHWS) | |
| Duration | April 12 – April 23 |
|---|---|
| Peak intensity | 155 km/h (100 mph) (10-min) 940 hPa (mbar) |
| Tropical storm (JMA) | |
| Tropical storm (SSHWS) | |
| Duration | April 22 – April 26 |
|---|---|
| Peak intensity | 65 km/h (40 mph) (10-min) 994 hPa (mbar) |
| Tropical storm (JMA) | |
| Tropical storm (SSHWS) | |
| Duration | May 5 – May 10 |
|---|---|
| Peak intensity | 65 km/h (40 mph) (10-min) 998 hPa (mbar) |
| Tropical storm (JMA) | |
| Tropical storm (SSHWS) | |
| Duration | May 26 – May 30 |
|---|---|
| Peak intensity | 75 km/h (45 mph) (10-min) 992 hPa (mbar) |
| Typhoon (JMA) | |
| Category 2 typhoon (SSHWS) | |
| Duration | May 27 – June 1 |
|---|---|
| Peak intensity | 120 km/h (75 mph) (10-min) 965 hPa (mbar) |
| Typhoon (JMA) | |
| Category 5 super typhoon (SSHWS) | |
| Duration | June 5 – June 14 |
|---|---|
| Peak intensity | 185 km/h (115 mph) (10-min) 930 hPa (mbar) |
| Typhoon (JMA) | |
| Category 2 typhoon (SSHWS) | |
| Duration | June 14 – June 20 |
|---|---|
| Peak intensity | 140 km/h (85 mph) (10-min) 960 hPa (mbar) |
| Typhoon (JMA) | |
| Category 1 typhoon (SSHWS) | |
| Duration | June 22 – June 28 |
|---|---|
| Peak intensity | 120 km/h (75 mph) (10-min) 970 hPa (mbar) |
The 1997 Pacific typhoon season has no official bounds; it ran year-round in 1997, but most tropical cyclones tend to form in the northwestern Pacific Ocean between May and November. These dates conventionally delimit the period of each year when most tropical cyclones form in the northwestern Pacific Ocean. This was the most active tropical cyclone season ever recorded, with a record ten Category 5 storms forming and with an ACE of 594.11.
The scope of this article is limited to the Pacific Ocean, north of the equator and west of the International Date Line. Storms that form east of the Date Line and north of the equator are called hurricanes; see 1997 Pacific hurricane season. Tropical Storms formed in the entire west Pacific basin were assigned a name by the Joint Typhoon Warning Center. Tropical depressions in this basin have the "W" suffix added to their number. Tropical depressions that enter or form in the Philippine area of responsibility are assigned a name by the Philippine Atmospheric, Geophysical and Astronomical Services Administration or PAGASA. This can often result in the same storm having two names.
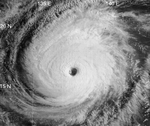
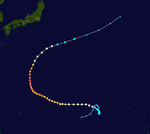
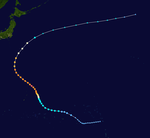
The season was unusual in the number of super typhoons that occurred in the basin, with eleven typhoons reaching winds of at least 135 knots. They were Isa, Nestor, Rosie, Winnie, Bing, Oliwa (from Central Pacific), Ginger, Ivan, Joan, Keith, and Paka (from Central Pacific). This was due to the strong El Niño of 1997-1998, which contributed to the record amounts of not only super typhoons but also tropical storms in the Western and Eastern Pacific. Fortunately, most of the stronger systems remained at sea.
When Severe Tropical Storm Peter made landfall in southern Japan on June 27, it marked the first time that two tropical cyclones made landfall in mainland Japan during the month of June since reliable records began in 1951. According to the Joint Typhoon Warning Center, eleven tropical cyclones attained super typhoon status, ten of which became Category 5 Super Typhoons, marking the highest number of Category 5 storms in a single season on record.
In early January, an area of convection developed along a near-equatorial trough just west of the International Date Line. It tracked steadily westward, and remained disorganized for about week. On January 18, deep convection increased as a low-level circulation began to form, and at 0000 UTC on January 19 it developed into Tropical Depression 01W while located to the southwest of Guam. Based on satellite imagery estimates, the Joint Typhoon Warning Center upgraded it to Tropical Storm Hannah six hours after first forming. The deep convection quickly organized into well-defined cyclonic bands, and early on January 20 Hannah attained its peak intensity of 60 mph near the island of Yap. Increased southeasterly wind shear weakened the storm, leaving its dwindling convection situated along the northern portion of the circulation. Interaction with a large and powerful extratropical cyclone left the storm moving erratically, and on January 22 Hannah weakened to tropical depression status. Its motion turned to a steady southwestward motion, and on January 27 Hannah dissipated a short distance east of the Philippine island of Mindanao.
...
Wikipedia


