1939 Atlantic hurricane season
| 1939 Atlantic hurricane season | |
|---|---|

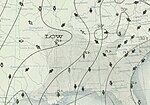
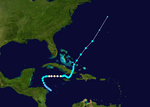
Season summary map
|
|
| Seasonal boundaries | |
| First system formed | June 12, 1939 |
| Last system dissipated | November 6, 1939 |
| Strongest storm | |
| Name | Five |
| • Maximum winds | 140 mph (220 km/h) |
| Seasonal statistics | |
| Total depressions | 10 |
| Total storms | 6 |
| Hurricanes | 3 |
| Major hurricanes (Cat. 3+) |
1 |
| Total fatalities | 5 |
| Total damage | Unknown |
| Tropical storm (SSHWS) | |
| Duration | June 12 – June 18 |
|---|---|
| Peak intensity | 65 mph (100 km/h) (1-min) ≤ 999 mbar (hPa) |
| Category 1 hurricane (SSHWS) | |
| Duration | August 7 – August 19 |
|---|---|
| Peak intensity | 75 mph (120 km/h) (1-min) 985 mbar (hPa) |
| Tropical storm (SSHWS) | |
| Duration | August 15 – August 19 |
|---|---|
| Peak intensity | 65 mph (100 km/h) (1-min) <1000 mbar (hPa) |
| Tropical storm (SSHWS) | |
| Duration | September 23 – September 27 |
|---|---|
| Peak intensity | 50 mph (85 km/h) (1-min) <1004 mbar (hPa) |
| Category 4 hurricane (SSHWS) | |
| Duration | October 12 – October 17 |
|---|---|
| Peak intensity | 140 mph (220 km/h) (1-min) ≤ 941 mbar (hPa) |
| Category 1 hurricane (SSHWS) | |
| Duration | October 28 – November 6 |
|---|---|
| Peak intensity | 90 mph (150 km/h) (1-min) ≤ 989 mbar (hPa) |
The 1939 Atlantic hurricane season officially began on June 12, 1939, and lasted until November 7, 1939. These dates mark the period of each year when most tropical cyclones form in the Atlantic basin. The 1939 season had below normal activity, with only six tropical storms, of which two became hurricanes and one became a major hurricane, equivalent to Category 3 status or higher on the modern-day Saffir-Simpson Hurricane Scale. The first tropical cyclone formed on June 12, and the last dissipated on November 6.
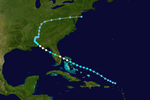
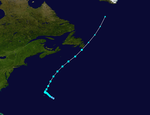
All of the storms affected land to some extent. The first two cyclones of the season made landfall along the coast of the United States, collectively causing only minor damage. Hurricane Five, the strongest of the year, took a northeastern path through the western Atlantic, striking Bermuda on October 16. The fifth and final storm was a minimal hurricane that wrought damage throughout the western Caribbean Sea, most notably in Jamaica and Cuba. The weakest known storm was Tropical Storm Four, with winds of only 50 miles per hour (80 km/h) and a minimum barometric pressure of 1,003 millibars (29.62 inHg).
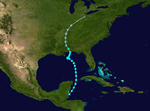
The first tropical storm of the season developed in the extreme western Caribbean Sea on June 12. Reports of the storm first came from the Mexican Weather Service office in Chetumal, Quintana Roo, and during the afternoon of June 12, vessels just offshore recorded squally conditions and choppy seas. The cyclone moved northward, parallel to the coast of Belize, before moving over the northeastern corner of the Yucatán Peninsula. It continued steadily northward through the Gulf of Mexico, slowly strengthening to a peak of 50 miles per hour (80 km/h) on June 14 with a minimum central pressure of 1,000.0 hectopascals (29.53 inHg). An area of high pressure to the north caused the storm to execute a counter-clockwise loop. A trough of low pressure turned it back to the north, and the cyclone made landfall near Mobile, Alabama, as a minimal tropical storm on June 16. Turning to the northwest, it quickly weakened to a tropical depression and dissipated on June 17 over Mississippi.
...
Wikipedia

