1940 Atlantic hurricane season
| 1940 Atlantic hurricane season |

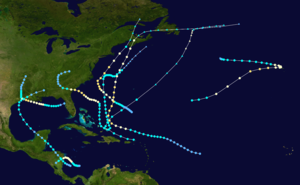
Season summary map
|
| Seasonal boundaries |
| First system formed |
May 19, 1940 |
| Last system dissipated |
November 8, 1940 |
| Strongest storm |
|
| Name |
Four |
| • Maximum winds |
110 mph (175 km/h) |
| • Lowest pressure |
961 mbar (hPa; 28.38 inHg) |
| Seasonal statistics |
| Total depressions |
14 |
| Total storms |
9 |
| Hurricanes |
6 |
Major hurricanes
(Cat. 3+) |
0 |
| Total fatalities |
71 |
| Total damage |
$29.329 million (1940 USD) |
|
|
Atlantic hurricane seasons
1938, 1939, 1940, 1941, 1942
|
| Tropical storm (SSHWS) |
|
|
| Duration |
May 19 – May 25 |
| Peak intensity |
65 mph (100 km/h) (1-min) <996 mbar (hPa) |
| Category 2 hurricane (SSHWS) |
|
|
| Duration |
August 3 – August 10 |
| Peak intensity |
100 mph (155 km/h) (1-min) 972 mbar (hPa) |
| Category 2 hurricane (SSHWS) |
|
|
| Duration |
August 5 – August 14 |
| Peak intensity |
100 mph (155 km/h) (1-min) 972 mbar (hPa) |
| Category 2 hurricane (SSHWS) |
|
|
| Duration |
August 26 – September 2 |
| Peak intensity |
110 mph (175 km/h) (1-min) 961 mbar (hPa) |
| Category 2 hurricane (SSHWS) |
|
|
| Duration |
September 7 – September 17 |
| Peak intensity |
100 mph (155 km/h) (1-min) <988 mbar (hPa) |
| Tropical storm (SSHWS) |
|
|
| Duration |
September 18 – September 25 |
| Peak intensity |
50 mph (85 km/h) (1-min) 1002 mbar (hPa) |
| Category 2 hurricane (SSHWS) |
|
|
| Duration |
September 22 – September 28 |
| Peak intensity |
100 mph (155 km/h) (1-min) <977 mbar (hPa) |
| Category 1 hurricane (SSHWS) |
|
|
| Duration |
October 20 – October 24 |
| Peak intensity |
80 mph (130 km/h) (1-min) <983 mbar (hPa) |
| Tropical storm (SSHWS) |
|
|
| Duration |
October 24 – October 26 |
| Peak intensity |
45 mph (75 km/h) (1-min) <1007 mbar (hPa) |
The 1940 Atlantic hurricane season was a generally average period of tropical cyclogenesis in 1940. Though the season had no official bounds, most tropical cyclone activity occurred during August and September. Throughout the year, fourteen tropical cyclones formed, of which nine reached tropical storm intensity; six were hurricanes. None of the hurricanes reached major hurricane intensity. Tropical cyclones that did not approach populated areas or shipping lanes, especially if they were relatively weak and of short duration, may have remained undetected. Because technologies such as satellite monitoring were not available until the 1960s, historical data on tropical cyclones from this period are often not reliable. As a result of a reanalysis project which analyzed the season in 2012, an additional hurricane was added to HURDAT. The year's first tropical storm formed on May 19 off the northern coast of Hispaniola. At the time, this was a rare occurrence, as only four other tropical disturbances were known to have formed prior during this period; since then, reanalysis of previous seasons has concluded that there were more than four tropical cyclones in May before 1940. The season's final system was a tropical disturbance situated in the Greater Antilles, which dissipated on November 8.
All three hurricanes in August brought flooding rainfall to areas of the United States. The first became the wettest tropical cyclone recorded in Louisiana history. The second hurricane impacted regions of the Southeastern United States, producing record precipitation and killing at least 52 people. Despite not making landfall, the third hurricane in August interacted with a stationary front over the Mid-Atlantic states, resulting in localized flooding and thus making the tropical cyclone the wettest in New Jersey history. This hurricane would also be the strongest in the hurricane season, with maximum sustained winds of 110 mph (175 km/h) and a minimum barometric pressure of 961 mbar (hPa; 28.39 inHg), making it a high-end Category 2 hurricane on the modern-day Saffir–Simpson hurricane wind scale. Activity decreased in September, though a damaging hurricane swept through areas of the Canadian Maritimes, resulting in large crop and infrastructural losses. Two tropical cyclones of at least tropical storm strength were recorded in October, though neither resulted in fatalities. Collectively, storms in the hurricane season caused 71 fatalities and $29.329 million in damages. The 1940 South Carolina hurricane, which swept through areas of the Southeastern United States in August, was the most damaging and deadly of the tropical cyclones.
...
Wikipedia


