Timeline of the 2003 Pacific typhoon season
| 2003 Pacific typhoon season |

Season summary map
|
| Seasonal boundaries |
| First system formed |
January 15, 2003 |
| Last system dissipated |
December 27, 2003 |
| Strongest storm |
|
| Name |
Maemi |
| • Maximum winds |
195 km/h (120 mph)
(10-minute sustained) |
| • Lowest pressure |
910 hPa (mbar) |
|
| Seasonal statistics |
| Total depressions |
45 |
| Total storms |
21 |
| Typhoons |
14 |
| Super typhoons |
5 (unofficial) |
| Total fatalities |
360 |
| Total damage |
At least $5.73 billion (2003 USD) |
| Related articles |
|
|
Pacific typhoon seasons
2001, 2002, 2003, 2004, 2005
|
| Tropical storm (JMA) |
| Tropical storm (SSHWS) |
|
|
| Duration |
January 15 – January 20 |
| Peak intensity |
65 km/h (40 mph) (10-min) 1000 hPa (mbar) |
| Typhoon (JMA) |
| Category 4 super typhoon (SSHWS) |
|
|
| Duration |
April 9 – April 25 |
| Peak intensity |
165 km/h (105 mph) (10-min) 930 hPa (mbar) |
| Typhoon (JMA) |
| Category 4 typhoon (SSHWS) |
|
|
| Duration |
May 19 – May 27 |
| Peak intensity |
155 km/h (100 mph) (10-min) 940 hPa (mbar) |
| Severe tropical storm (JMA) |
| Tropical storm (SSHWS) |
|
|
| Duration |
May 25 – May 30 |
| Peak intensity |
100 km/h (65 mph) (10-min) 980 hPa (mbar) |
| Severe tropical storm (JMA) |
| Tropical storm (SSHWS) |
|
|
| Duration |
May 30 – June 3 |
| Peak intensity |
95 km/h (60 mph) (10-min) 985 hPa (mbar) |
| Typhoon (JMA) |
| Category 4 typhoon (SSHWS) |
|
|
| Duration |
June 12 – June 19 |
| Peak intensity |
150 km/h (90 mph) (10-min) 955 hPa (mbar) |
| Typhoon (JMA) |
| Category 4 super typhoon (SSHWS) |
|
|
| Duration |
July 15 – July 25 |
| Peak intensity |
165 km/h (105 mph) (10-min) 935 hPa (mbar) |
| Severe tropical storm (JMA) |
| Category 1 typhoon (SSHWS) |
|
|
| Duration |
July 15 – July 23 |
| Peak intensity |
110 km/h (70 mph) (10-min) 975 hPa (mbar) |
| Tropical storm (JMA) |
| Category 1 typhoon (SSHWS) |
|
|
| Duration |
July 31 – August 4 |
| Peak intensity |
85 km/h (50 mph) (10-min) 992 hPa (mbar) |
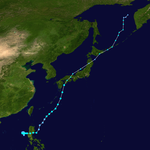
The 2003 Pacific typhoon season was a slightly below average yearlong period of tropical cyclogenesis exhibiting the development of 45 tropical depressions, of which 21 became named storms; of those, 14 became typhoons. Though every month with the exception of February and March featured tropical activity, most storms developed from May through October. During the season, tropical cyclones affected the Philippines, Japan, China, the Korean Peninsula, Indochina, and various islands in the western Pacific.
The season ran year-round, with the first storm, Yanyan, developing west of the Marshall Islands on January 15. In April, Typhoon Kujira became one of the longest-lasting Pacific typhoons in history and attained climatological records for its unusually early impacts. Typhoon Imbudo in July caused several deaths and extensive damage across the Philippines and China. In September, Typhoon Maemi became one of the costliest typhoons in recorded history after striking South Korea; Maemi was also the most intense tropical cyclone of the season with a minimum barometric pressure of 910 mbar (hPa; 26.87 inHg). In late November, Typhoon Lupit devastated areas of Yap State in the Federated States of Micronesia. The season closed with the dissipation of a tropical depression east of the Philippines on December 27.
The scope of this article is limited to the Pacific Ocean, north of the equator and west of the International Date Line. Storms that form east of the date line and north of the equator are called hurricanes; see 2003 Pacific hurricane season. Tropical Storms formed in the entire west Pacific basin are assigned a name by the Tokyo Typhoon Center. Tropical depressions in this basin monitored by the Joint Typhoon Warning Center (JTWC) have the "W" suffix added to their number. Tropical depressions that enter or form in the Philippine area of responsibility are assigned a name by the Philippine Atmospheric, Geophysical and Astronomical Services Administration or PAGASA. This can often result in the same storm having two names.
...
Wikipedia


