2004–05 Australian region cyclone season
| 2004–05 Australian region cyclone season | |
|---|---|

Season summary map
|
|
| Seasonal boundaries | |
| First system formed | 1 September 2004 |
| Last system dissipated | 15 April 2005 |
| Strongest storm | |
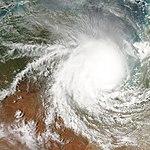
| Name | Ingrid |
| • Maximum winds | 220 km/h (140 mph) (10-minute sustained) |
| • Lowest pressure | 924 hPa (mbar) |
| Seasonal statistics | |
| Tropical lows | 13 |
| Tropical cyclones | 10 |
| Severe tropical cyclones | 4 |
| Total fatalities | Unknown |
| Total damage | Unknown |
| Related articles | |
| Category 1 tropical cyclone (Australian scale) | |
| Tropical storm (SSHWS) | |
| Duration | 1 September (Entered basin) – 5 September |
|---|---|
| Peak intensity | 85 km/h (50 mph) (10-min) 990 hPa (mbar) |
| Tropical low (Australian scale) | |
| Tropical storm (SSHWS) | |
| Duration | 3 December – 5 December |
|---|---|
| Peak intensity | 55 km/h (35 mph) (10-min) 998 hPa (mbar) |
| Category 1 tropical cyclone (Australian scale) | |
| Tropical storm (SSHWS) | |
| Duration | 30 December – 10 January |
|---|---|
| Peak intensity | 85 km/h (50 mph) (10-min) 985 hPa (mbar) |
| Category 2 tropical cyclone (Australian scale) | |
| Tropical storm (SSHWS) | |
| Duration | 7 January – 9 January |
|---|---|
| Peak intensity | 95 km/h (60 mph) (10-min) 985 hPa (mbar) |
| Category 3 severe tropical cyclone (Australian scale) | |
| Category 2 tropical cyclone (SSHWS) | |
| Duration | 8 January – 18 January |
|---|---|
| Peak intensity | 150 km/h (90 mph) (10-min) 955 hPa (mbar) |
| Tropical low (Australian scale) | |
| Tropical storm (SSHWS) | |
| Duration | 11 January – 17 January |
|---|---|
| Peak intensity | 55 km/h (35 mph) (10-min) 998 hPa (mbar) |
| Category 1 tropical cyclone (Australian scale) | |
| Tropical storm (SSHWS) | |
| Duration | 23 January – 25 January |
|---|---|
| Peak intensity | 85 km/h (50 mph) (10-min) 990 hPa (mbar) |
| Category 3 severe tropical cyclone (Australian scale) | |
| Tropical storm (SSHWS) | |
| Duration | 5 February – 7 February |
|---|---|
| Peak intensity | 130 km/h (80 mph) (10-min) 967 hPa (mbar) |
| Category 1 tropical cyclone (Australian scale) | |
| Tropical storm (SSHWS) | |
| Duration | 4 February – 9 February |
|---|---|
| Peak intensity | 65 km/h (40 mph) (10-min) 990 hPa (mbar) |
The 2004–05 Australian region cyclone season was a slightly below average tropical cyclone season. It began on 1 November 2004 and ended on 30 April 2005. The regional tropical cyclone operational plan also defines a tropical cyclone year separately from a tropical cyclone season, which runs from 1 July 2004 to 30 June 2005.
Tropical cyclones in this area are monitored by four Tropical Cyclone Warning Centres (TCWCs): the Australian Bureau of Meteorology in Perth, Darwin, and Brisbane; and TCWC Port Moresby in Papua New Guinea.
A tropical disturbance developed in the east of the region monitored by Réunion on 30 August, from an active monsoon band that coincided with a burst in the Madden–Julian oscillation. The system moved southeast and entered the Perth Tropical Cyclone Warning Centre's area of responsibility on 1 September.
The system was upgraded to Tropical Cyclone Phoebe early on 2 September when it was about 800 km west-northwest of the Cocos Islands. Phoebe quickly reached its peak strength that day, with winds of 85 km/h, as it continued to move to the southeast. The cyclone weakened as it moved over cooler water and dissipated about 550 km from the Cocos Islands. Phoebe posed no threat to any land.
A tropical low developed in the Perth AOR on 2 December near the coast of Java. According to Perth, the storm had a maximum sustained winds of 30 knots (56 km/h), while the JTWC assigned the storm peak sustained winds of 35 knots (65 km/h) and classifying it as a tropical storm.
...
Wikipedia


