1991–92 Australian region cyclone season
| 1991–92 Australian region cyclone season |

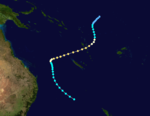
Season summary map
|
| Seasonal boundaries |
| First system formed |
2 December 1991 |
| Last system dissipated |
13 April 1992 |
| Strongest storm |
|
| Name |
Graham |
| • Maximum winds |
230 km/h (145 mph)
(10-minute sustained) |
| • Lowest pressure |
915 hPa (mbar) |
| Seasonal statistics |
| Tropical lows |
12 |
| Tropical cyclones |
10 |
| Severe tropical cyclones |
9 |
| Total fatalities |
7 |
| Total damage |
$13.94 million (1992 USD) |
| Related articles |
|
|
Australian region tropical cyclone seasons
1989–90, 1990–91, 1991–92, 1992–93, 1993–94
|
| Category 5 severe tropical cyclone (Australian scale) |
| Category 4 tropical cyclone (SSHWS) |
|
|
| Duration |
2 December – 10 December |
| Peak intensity |
230 km/h (145 mph) (10-min) 915 hPa (mbar) |
| Category 2 tropical cyclone (Australian scale) |
| Tropical storm (SSHWS) |
|
|
| Duration |
7 January – 10 January |
| Peak intensity |
100 km/h (60 mph) (10-min) 980 hPa (mbar) |
| Category 4 severe tropical cyclone (Australian scale) |
| Category 2 tropical cyclone (SSHWS) |
|
|
| Duration |
10 January (Crossed 160°E) – 14 January (Crossed 160°E)
|
| Peak intensity |
185 km/h (115 mph) (10-min) 950 hPa (mbar) |
| Category 3 severe tropical cyclone (Australian scale) |
| Category 1 tropical cyclone (SSHWS) |
|
|
| Duration |
17 February (Crossed 160°E) – 19 February |
| Peak intensity |
120 km/h (75 mph) (10-min) 965 hPa (mbar) |
| Category 5 severe tropical cyclone (Australian scale) |
| Category 4 tropical cyclone (SSHWS) |
|
|
| Duration |
24 February – 8 March |
| Peak intensity |
210 km/h (130 mph) (10-min) 930 hPa (mbar) |
| Category 5 severe tropical cyclone (Australian scale) |
| Category 4 tropical cyclone (SSHWS) |
|
|
| Duration |
27 February – 4 March |
| Peak intensity |
210 km/h (130 mph) (10-min) 930 hPa (mbar) |
| Category 4 severe tropical cyclone (Australian scale) |
| Category 4 tropical cyclone (SSHWS) |
|
|
| Duration |
February 28 (entered basin) – March 1 (crossed basin)
|
| Peak intensity |
185 km/h (115 mph) (10-min) 925 hPa (mbar) |
| Category 3 severe tropical cyclone (Australian scale) |
| Category 2 tropical cyclone (SSHWS) |
|
|
| Duration |
11 March (Crossed 160°E) – 17 March |
| Peak intensity |
150 km/h (90 mph) (10-min) 950 hPa (mbar) |
| Category 3 severe tropical cyclone (Australian scale) |
| Category 4 tropical cyclone (SSHWS) |
|
|
| Duration |
7 April – 13 April |
| Peak intensity |
155 km/h (100 mph) (10-min) 945 hPa (mbar) |
The 1991–92 Australian region cyclone season saw several intense storms. It was also an event in the ongoing cycle of tropical cyclone formation. It ran from 1 November 1991 to 30 April 1992. The regional tropical cyclone operational plan also defines a tropical cyclone year separately from a tropical cyclone season, and the "tropical cyclone year" ran from 1 July 1991 to 30 June 1992.
Tropical cyclones in this area were monitored by four Tropical Cyclone Warning Centres (TCWCs): the Australian Bureau of Meteorology in Perth, Darwin, and Brisbane; and TCWC Port Moresby in Papua New Guinea.
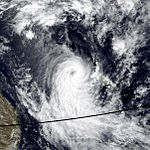
On 2 December, a south-southwestly moving low pressure system formed. Rapidly intensifying, Tropical cyclone Graham was classified the next day about 750 km (470 mi) northwest of Cocos Island. Within 24 hours, an eye developed. Shortly thereafter, Graham turned towards the southeast due to influence of a deep-layer anticyclone to the east. Maximum intensity was reached at 1500 UTC 5 December as a Category 5 system. As the cyclone tracked away from Cocos Island, it encountered less favorable conditions. By 0000 UTC 8 December, the low-level circulation became fully exposed on the northwest side of the deep convection. Graham weakened below cyclone intensity at 1800 UTC 9 December and became devoid of convection the next day.
Tropical cyclone Mark formed within the monsoon trough in the Timor Sea, west of Melville Island, on 6 January. The system tracked rapidly eastwards across northern Australia, entering the Gulf of Carpentaria at 1200 UTC 7 January. Once over water, satellite imagery indicated that the system slowly organized and by 0600 UTC 8 January, whilst approaching the central Gulf of Carpentaria, it was upgraded into a Category 1 cyclone. Upon naming, Mark slowed and adopted a slightly northeastward track in response to enhanced ridging to the south. This track was maintained for the next 40 hours and at 2100 UTC 9 January, Mark crossed the western coast of Cape York Peninsula just south of Weipa. Maximum sustained winds at landfall were estimated at 100 km/h (62 mph) with a central pressure of 980 mbar (29 inHg). Mark soon weakened as it crossed the peninsula and was downgraded to a tropical depression at 1200 UTC 10 January. Mark dissipated later that day. Weipa, Australia sustained minor, but widespread damage with failing trees often being a consequence for damage to houses and power lines. High waves brought $3.5 million (AUD) damage to the Weipa port.
...
Wikipedia


