1991–92 South Pacific cyclone season
| 1991–92 South Pacific cyclone season |

Season summary map
|
| Seasonal boundaries |
| First system formed |
November 13, 1991 |
| Last system dissipated |
May 2, 1992 |
| Strongest storm |
|
| Name |
Fran |
| • Maximum winds |
205 km/h (125 mph)
(10-minute sustained) |
| • Lowest pressure |
920 hPa (mbar) |
| Seasonal statistics |
| Total depressions |
13 |
| Tropical cyclones |
11 |
| Severe tropical cyclones |
7 |
| Total fatalities |
21 |
| Total damage |
≥ $360 million (1992 USD) |
| Related articles |
|
|
South Pacific tropical cyclone seasons
1989–90, 1990–91, 1991–92, 1992–93, 1993–94
|
| Category 3 severe tropical cyclone (Australian scale) |
| Category 2 tropical cyclone (SSHWS) |
|
|
| Duration |
November 13 – November 21 |
| Peak intensity |
140 km/h (85 mph) (10-min) 960 hPa (mbar) |
| Category 4 severe tropical cyclone (Australian scale) |
| Category 3 tropical cyclone (SSHWS) |
|
|
| Duration |
December 3 – December 16 |
| Peak intensity |
165 km/h (105 mph) (10-min) 940 hPa (mbar) |
| Category 4 severe tropical cyclone (Australian scale) |
| Category 4 tropical cyclone (SSHWS) |
|
|
| Duration |
December 4 – December 17 |
| Peak intensity |
165 km/h (105 mph) (10-min) 940 hPa (mbar) |
| Category 4 severe tropical cyclone (Australian scale) |
| Category 2 tropical cyclone (SSHWS) |
|
|
| Duration |
January 4 – January 15 |
| Peak intensity |
165 km/h (105 mph) (10-min) 940 hPa (mbar) |
| Category 2 tropical cyclone (Australian scale) |
| Category 1 tropical cyclone (SSHWS) |
|
|
| Duration |
February 4 – February 9 |
| Peak intensity |
100 km/h (65 mph) (10-min) 980 hPa (mbar) |
| Category 3 severe tropical cyclone (Australian scale) |
| Category 2 tropical cyclone (SSHWS) |
|
|
| Duration |
February 11 – February 19 |
| Peak intensity |
130 km/h (80 mph) (10-min) 965 hPa (mbar) |
| Category 4 severe tropical cyclone (Australian scale) |
| Category 4 tropical cyclone (SSHWS) |
|
|
| Duration |
February 24 – March 7 |
| Peak intensity |
185 km/h (115 mph) (10-min) 925 hPa (mbar) |
| Category 5 severe tropical cyclone (Australian scale) |
| Category 5 tropical cyclone (SSHWS) |
|
|
| Duration |
March 4 – March 11 (crossed basin)
|
| Peak intensity |
205 km/h (125 mph) (10-min) 920 hPa (mbar) |
| Category 2 tropical cyclone (Australian scale) |
| Tropical storm (SSHWS) |
|
|
| Duration |
March 13 – March 19 |
| Peak intensity |
90 km/h (55 mph) (10-min) 985 hPa (mbar) |
The 1991–92 South Pacific cyclone season was an above average tropical cyclone season, with eleven tropical cyclones occurring within the South Pacific basin between 160°E and 120°W. The first tropical cyclone of the season was first noted on November 13, 1991, while the last tropical cyclone dissipated on May 2, 1992. During the season at least 21 people were killed by tropical cyclones, while Tropical Cyclones Cliff and Innis were the only tropical cyclones not to cause any damage to any country in the Southern Pacific.
During the season, tropical cyclones were monitored by the Tropical Cyclone Warning Centers (TCWC) in Nadi, Fiji, and in Wellington, New Zealand. Whilst tropical cyclones that moved or formed to the west of 160°E were monitored as a part of the Australian region by the Australian Bureau of Meteorology. Both the United States Joint Typhoon Warning Center (JTWC) and the Naval Western Oceanography Center (NWOC) issued unofficial warnings within the southern Pacific. The JTWC issued warnings between 160°E and the International Date Line whilst the NWOC issued warnings for tropical cyclones forming between the International Date Line and the coasts of the Americas. Both the JTWC and the NWOC designated tropical cyclones with a number and a P suffix with numbers assigned in order to tropical cyclones developing within the whole of the South Pacific. TCWC Nadi and TCWC Wellington both use the Australian Tropical Cyclone Intensity Scale, and measure windspeeds over a period of ten minutes, while the JTWC and the NWOC measured sustained winds over a period of one minute which are compared to the Saffir–Simpson hurricane wind scale.
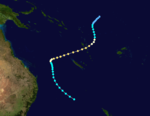
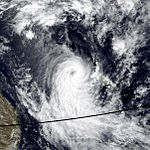
During the season a significant increase in the amount of tropical cyclones occurring within the South Pacific basin was observed, with eleven tropical cyclones occurring within the basin during the season compared to three during the previous season. This increase was attributed to a mature El Niño episode, that had started developing towards the end of the previous season. During the season the major areas of tropical cyclogenesis were shifted eastwards, from their mean position towards the more central parts of Pacific. The first tropical cyclone of the season was first noted as a tropical depression on November 13, before it was named Tia during November 16, after it had become a category 1 tropical cyclone on the Australian tropical cyclone intensity scale. Over the next day the system rapidly intensified into a category 3 severe tropical cyclone and affected the Solomon Islands of Tikopia and Anuta while near its peak intensity. Tia subsequently started to weaken during November 19, as it became the first of six tropical cyclones to affect Vanuatu during the season.
...
Wikipedia


