1959 Pacific typhoon season
| 1959 Pacific typhoon season |

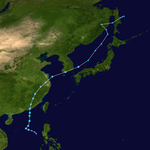
Season summary map
|
| Seasonal boundaries |
| First system formed |
February 27, 1959 |
| Last system dissipated |
January 2, 1960 |
| Strongest storm |
|
| Name |
Joan |
| • Maximum winds |
315 km/h (195 mph) |
| • Lowest pressure |
885 hPa (mbar) |
| Seasonal statistics |
| Total depressions |
33 |
| Total storms |
25 |
| Typhoons |
18 |
| Super typhoons |
8 |
| Total fatalities |
> 8,557 |
| Total damage |
> $755 million (1959 USD) |
| Related articles |
|
|
Pacific typhoon seasons
1957, 1958, 1959, 1960, 1961
|
| Tropical storm (SSHWS) |
|
|
| Duration |
February 27 – March 1 |
| Peak intensity |
95 km/h (60 mph) (1-min) 1000 hPa (mbar) |
| Tropical storm (SSHWS) |
|
|
| Duration |
March 4 – March 13 |
| Peak intensity |
100 km/h (65 mph) (1-min) 990 hPa (mbar) |
| Category 4 typhoon (SSHWS) |
|
|
| Duration |
April 14 – April 23 |
| Peak intensity |
230 km/h (145 mph) (1-min) 930 hPa (mbar) |
| Tropical depression (SSHWS) |
|
|
| Duration |
June 28 – June 29 |
| Peak intensity |
45 km/h (30 mph) (1-min) 1001 hPa (mbar) |
| Tropical depression (SSHWS) |
|
|
| Duration |
July 4 – July 8 |
| Peak intensity |
55 km/h (35 mph) (1-min) 995 hPa (mbar) |
| Tropical depression (SSHWS) |
|
|
| Duration |
July 4 – July 6 |
| Peak intensity |
55 km/h (35 mph) (1-min) |
| Category 2 typhoon (SSHWS) |
|
|
| Duration |
July 12 – July 18 |
| Peak intensity |
165 km/h (105 mph) (1-min) 970 hPa (mbar) |
| Category 3 typhoon (SSHWS) |
|
|
| Duration |
August 2 – August 12 |
| Peak intensity |
185 km/h (115 mph) (1-min) 965 hPa (mbar) |
| Tropical depression (SSHWS) |
|
|
| Duration |
August 11 – August 12 |
| Peak intensity |
55 km/h (35 mph) (1-min) |
The 1959 Pacific typhoon season was regarded as one of the most devastating years for Pacific typhoons on record, with China, Japan and South Korea sustaining catastrophic losses.
The scope of this article is limited to the Pacific Ocean, north of the equator and west of the International Date Line. Storms that form east of the Date Line and north of the equator are called hurricanes; see 1959 Pacific hurricane season. All typhoons were assigned a name and number. Tropical storms and tropical depressions formed in the entire west Pacific basin were assigned a name and number by the Joint Typhoon Warning Center, but the latter was not added if no reconnaissance missions were assigned. Systems handled by the responsibility of the USWB and FWB featured no number.
The 1959 Pacific typhoon season featured 24 tropical cyclones, though operationally 59 total areas of investigation were classified by the Joint Typhoon Warning Center (JTWC); three systems were handled by the responsibility of FWB at Pearl Harbor and the USWB at Honolulu. Three systems were questionable due to lack of reconnaissance aircraft use. In total, the season featured 65 tropical cyclones and areas of investigation operationally, including central Pacific Hurricane Patsy, which was operationally believed to have crossed the International Date Line into the western Pacific. The first annual tropical cyclone report for the western North Pacific Ocean was issued by the agency.
Of the 33 tropical cyclones and 65 total areas of investigation, 18 storms attained typhoon status, which was below the yearly average of 19. At least nine other tropical systems never exceeded tropical storm intensity operationally. Most of the systems were noted to have developed within the typical spawning grounds for typhoons originating from easterly waves within the Intertropical Convergence Zone; the exceptions were Ellen and Georgia which developed from cold-core troughs extending southward into the tropical latitudes. Of the 18 typhoons that formed, five were first detected within 300 miles (500 km) of the island of Guam. Three of the typhoons developed at a slow rate, while three others rapidly intensified to typhoon status within hours. Only four typhoons were small in diameter, while at least three typhoons developed to large sizes and became the dominant tropical features during the season. Two of the typhoons — Joan and Vera — featured sea-level pressures below 900 millibars and were the most intense tropical cyclones during the season, each featuring winds of 190 mph (305 km/h) or greater. Of the total number of typhoons, 215 reconnaissance missions were flown into the storms, including 3,799 observations and 391 total fixes. The average track error for each advisory for storms during the season was 63.9 miles (102.8 km) for 12-hour forecasts and 301.6 miles (485.4 km) for 48-hour forecasts.
...
Wikipedia


