Western Poland
| Geography of Poland | |
|---|---|
| Topography | |
 |
|
| Major agglomerations | |
|
Interactive map with links to articles
|
|
| Provinces and highways | |
 |
|
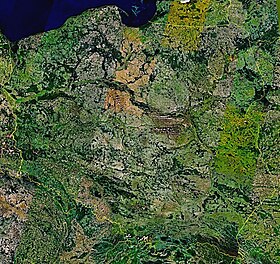
| Satellite photo by NASA Landsat 7 | |
 |
|
| Hypsometry | |
 |
|
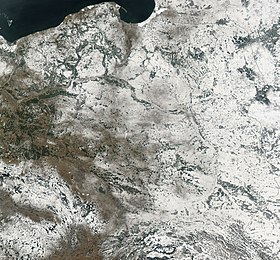
| Satellite photo, winter 2003 | |

Snow cover in mid-winter
|
| Warsaw | ||||||||||||||||||||||||||||||||||||||||||||||||||||||||||||
|---|---|---|---|---|---|---|---|---|---|---|---|---|---|---|---|---|---|---|---|---|---|---|---|---|---|---|---|---|---|---|---|---|---|---|---|---|---|---|---|---|---|---|---|---|---|---|---|---|---|---|---|---|---|---|---|---|---|---|---|---|
| Climate chart () | ||||||||||||||||||||||||||||||||||||||||||||||||||||||||||||
|
||||||||||||||||||||||||||||||||||||||||||||||||||||||||||||
|
||||||||||||||||||||||||||||||||||||||||||||||||||||||||||||
| J | F | M | A | M | J | J | A | S | O | N | D |
|
21
0
−6
|
25
1
−6
|
24
5
−1
|
33
12
4
|
44
19
9
|
62
22
14
|
73
24
15
|
63
23
14
|
42
18
10
|
37
13
4
|
38
5
1
|
33
2
−3
|
| Average max. and min. temperatures in °C | |||||||||||
| Precipitation totals in mm | |||||||||||
| Source: [1] | |||||||||||
| Imperial conversion | |||||||||||
|---|---|---|---|---|---|---|---|---|---|---|---|
| J | F | M | A | M | J | J | A | S | O | N | D |
|
0.8
32
21
|
1
34
22
|
0.9
40
30
|
1.3
54
40
|
1.7
67
47
|
2.4
71
56
|
2.9
75
59
|
2.5
73
56
|
1.7
65
49
|
1.5
55
38
|
...
| |

