History of Nanjing
|
Nanjing 南京市 |
|
|---|---|
| Sub-provincial city | |
| Nanjing City | |

Clockwise from top: 1. the city, Xuanwu Lake and Purple Mountain; 2. stone sculpture "bixie"; 3. Jiming Temple; 4. Yijiang Gate with the City Wall of Nanjing; 5. Qinhuai River and Fuzi Miao; 6. Nanjing Olympic Sports Center; 7. the spirit way of Ming Xiaoling Mausoleum; 8. Sun Yat-sen Mausoleum
|
|
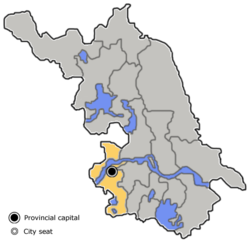
 Location of Nanjing City jurisdiction in Jiangsu |
|
| Coordinates: 32°03′N 118°46′E / 32.050°N 118.767°ECoordinates: 32°03′N 118°46′E / 32.050°N 118.767°E | |
| Country | People's Republic of China |
| Province | Jiangsu |
| County-level | 11 |
| Township-level | 129 |
| Settled | unknown (Yecheng, 495 BC. Jinling City, 333 BC) |
| Government | |
| • Type | Sub-provincial city |
| • Party Secretary | Zhang Jinghua |
| • Mayor | Lan Shaomin |
| Area | |
| • Sub-provincial city | 6,587.02 km2 (2,543.26 sq mi) |
| Elevation | 20 m (50 ft) |
| Population (2017) | |
| • Sub-provincial city | 8,335,000 |
| • Density | 1,237/km2 (3,183/sq mi) |
| • Metro | 11.7 million |
| Demonym(s) | Nanjingese |
| Time zone | China Standard (UTC+8) |
| Postal code | 210000–211300 |
| Area code(s) | 25 |
| GDP (Nominal) | 2017 |
| - Total | US$ 173.5 billion |
| - Per capita | US$ 20,899 |
| - Growth |
|
| GDP (PPP) | 2017 |
| - Total | US$ 334.1 billion |
| - Per capita | US$ 40,246 |
| Licence plate prefixes | 苏A |
| Website | City of Nanjing |
|
Deodar Cedar (Cedrus deodara), Platanus × acerifolia Méi (Prunus mume) |
|
| Nanjing | |||||||||||||||||||||||||||||||
|
"Nanjing" in Chinese characters
|
|||||||||||||||||||||||||||||||
| Chinese | 南京 | ||||||||||||||||||||||||||||||
|---|---|---|---|---|---|---|---|---|---|---|---|---|---|---|---|---|---|---|---|---|---|---|---|---|---|---|---|---|---|---|---|
| Postal | Nanking | ||||||||||||||||||||||||||||||
| Literal meaning | "Southern Capital" | ||||||||||||||||||||||||||||||
|
|||||||||||||||||||||||||||||||
| Nanjing | ||||||||||||||||||||||||||||||||||||||||||||||||||||||||||||
|---|---|---|---|---|---|---|---|---|---|---|---|---|---|---|---|---|---|---|---|---|---|---|---|---|---|---|---|---|---|---|---|---|---|---|---|---|---|---|---|---|---|---|---|---|---|---|---|---|---|---|---|---|---|---|---|---|---|---|---|---|
| Climate chart () | ||||||||||||||||||||||||||||||||||||||||||||||||||||||||||||
|
||||||||||||||||||||||||||||||||||||||||||||||||||||||||||||
|
||||||||||||||||||||||||||||||||||||||||||||||||||||||||||||
| J | F | M | A | M | J | J | A | S | O | N | D |
|
45
7
−1
|
53
10
1
|
80
14
5
|
80
21
11
|
90
26
17
|
166
29
21
|
214
32
25
|
144
32
24
|
73
28
20
|
60
23
14
|
56
16
7
|
30
10
1
|
| Average max. and min. temperatures in °C | |||||||||||
| Precipitation totals in mm | |||||||||||
| Source: CMA | |||||||||||
| Imperial conversion | |||||||||||
|---|---|---|---|---|---|---|---|---|---|---|---|
| J | F | M | A | M | J | J | A | S | O | N | D |
|
Wikipedia
...
| |||||||||||

