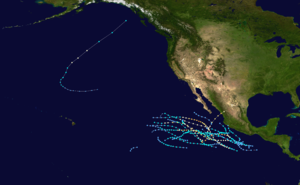
1975 Pacific hurricane season
| 1975 Pacific hurricane season | |
|---|---|

Season summary map
|
|
| Seasonal boundaries | |
| First system formed | June 2, 1975 |
| Last system dissipated | November 7, 1975 |
| Strongest storm | |
| Name | Denise |
| • Maximum winds | 140 mph (220 km/h) (1-minute sustained) |
| • Lowest pressure | 934 mbar (hPa; 27.58 inHg) |
| Seasonal statistics | |
| Total depressions | 21 |
| Total storms | 17 |
| Hurricanes | 9 |
| Major hurricanes (Cat. 3+) |
4 |
| Total fatalities | 30 |
| Total damage | Unknown |
| Related articles | |
| Category 1 hurricane (SSHWS) | |
| Duration | June 2 – June 5 |
|---|---|
| Peak intensity | 80 mph (130 km/h) (1-min) ≤ 1005 mbar (hPa) |
| Tropical storm (SSHWS) | |
| Duration | June 28 – July 3 |
|---|---|
| Peak intensity | 65 mph (100 km/h) (1-min) |
| Category 3 hurricane (SSHWS) | |
| Duration | July 2 – July 11 |
|---|---|
| Peak intensity | 125 mph (205 km/h) (1-min) |
| Category 4 hurricane (SSHWS) | |
| Duration | July 5 – July 15 |
|---|---|
| Peak intensity | 140 mph (220 km/h) (1-min) |
| Tropical storm (SSHWS) | |
| Duration | July 10 – July 12 |
|---|---|
| Peak intensity | 40 mph (65 km/h) (1-min) |
| Tropical storm (SSHWS) | |
| Duration | July 27 – July 30 |
|---|---|
| Peak intensity | 50 mph (85 km/h) (1-min) |
| Tropical storm (SSHWS) | |
| Duration | August 11 – August 14 |
|---|---|
| Peak intensity | 45 mph (75 km/h) (1-min) |
| Tropical storm (SSHWS) | |
| Duration | August 13 – August 17 |
|---|---|
| Peak intensity | 60 mph (95 km/h) (1-min) |
| Category 2 hurricane (SSHWS) | |
| Duration | August 18 – August 26 |
|---|---|
| Peak intensity | 105 mph (165 km/h) (1-min) |
The 1975 Pacific hurricane season officially started May 15, 1975, in the eastern Pacific, and June 1, 1975, in the central Pacific, and lasted until November 30, 1975. These dates conventionally delimit the period of each year when most tropical cyclones form in the northeast Pacific Ocean.
The 1975 Pacific hurricane season was near average, with 17 tropical storms forming. Of these, 9 became hurricanes, and 4 became major hurricanes by reaching Category 3 or higher on the Saffir-Simpson Hurricane Scale. The only notable storms are Hurricane Olivia, which killed 30 people, caused $30 million (1975 USD) in damage, and left thousands homeless when it made landfall in October; and an unnamed hurricane that developed at very high latitude, but had no effect on land. Hurricane Denise was the strongest storm of the year. Hurricanes Lily and Katrina passed close to Socorro Island and Tropical Storm Eleanor made landfall in Mexico. Hurricane Agatha sank a ship.
The season began with the formation of Tropical Depression One on June 2 and ended with the extratropical transition of Tropical Storm Priscilla on November 7. No named systems formed in May, two in June, four in July, six in August, three in September, one in October, and one in November. The total length of the season, from the formation of the first depression to the dissipation of the last, was 158 days.
In the eastern Pacific proper (east of 140°W), sixteen tropical storms and eight hurricanes formed. Four of the hurricanes became major hurricanes by reaching Category 3 or higher on the Saffir-Simpson Hurricane Scale. These numbers are close to the long-term averages of fifteen tropical storms, nine hurricanes, and four major hurricanes. There were also four unnamed tropical depressions. The only system to enter or form in the central Pacific (between 140°W and the international dateline) was an unusual high-latitude hurricane.
The only systems to make landfall this year were Tropical Storm Eleanor and Hurricane Olivia. Besides these two systems, Hurricane Agatha caused the sinking of a ship carrying millions of dollars worth of cargo. Tropical Storm Eleanor caused no serious impact.
...
Wikipedia


