1975 Pacific typhoon season
| 1975 Pacific typhoon season | |
|---|---|

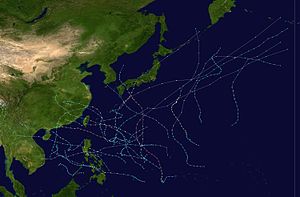
Season summary map
|
|
| Seasonal boundaries | |
| First system formed | January 21, 1975 |
| Last system dissipated | December 30, 1975 |
| Strongest storm | |
| Name | June |
| • Maximum winds | 295 km/h (185 mph) (1-minute sustained) |
| • Lowest pressure | 875 hPa (mbar) |
| Seasonal statistics | |
| Total depressions | 25 |
| Total storms | 20 |
| Typhoons | 14 |
| Super typhoons | 3 |
| Total fatalities | >229,160 |
| Total damage | > $1.2 billion (1975 USD) |
| Related articles | |
| Category 1 typhoon (SSHWS) | |
| Duration | January 21 – January 28 |
|---|---|
| Peak intensity | 130 km/h (80 mph) (1-min) 975 hPa (mbar) |
| Tropical depression (SSHWS) | |
| Duration | April 22 – April 28 |
|---|---|
| Peak intensity | 45 km/h (30 mph) (1-min) 1005 hPa (mbar) |
| Tropical storm (SSHWS) | |
| Duration | July 26 – July 30 |
|---|---|
| Peak intensity | 75 km/h (45 mph) (1-min) 992 hPa (mbar) |
| Category 4 super typhoon (SSHWS) | |
| Duration | July 30 – August 6 |
|---|---|
| Peak intensity | 250 km/h (155 mph) (1-min) 900 hPa (mbar) |
| Tropical depression (PAGASA) | |
| Tropical depression (SSHWS) | |
| Duration | August 5 – August 7 |
|---|---|
| Peak intensity | 55 km/h (35 mph) (10-min) |
| Category 1 typhoon (SSHWS) | |
| Duration | August 9 – August 15 |
|---|---|
| Peak intensity | 120 km/h (75 mph) (1-min) 970 hPa (mbar) |
| Category 4 typhoon (SSHWS) | |
| Duration | August 11 – August 18 |
|---|---|
| Peak intensity | 220 km/h (140 mph) (1-min) 920 hPa (mbar) |
| Category 1 typhoon (SSHWS) | |
| Duration | August 17 – August 24 |
|---|---|
| Peak intensity | 150 km/h (90 mph) (1-min) 965 hPa (mbar) |
| Tropical storm (SSHWS) | |
| Duration | August 25 – September 3 |
|---|---|
| Peak intensity | 95 km/h (60 mph) (1-min) 985 hPa (mbar) |
The 1975 Pacific typhoon season has no official bounds; it ran year-round in 1975, but most tropical cyclones tend to form in the northwestern Pacific Ocean between June and December. These dates conventionally delimit the period of each year when most tropical cyclones form in the northwestern Pacific Ocean.
The scope of this article is limited to the Pacific Ocean, north of the equator and west of the international date line. Storms that form east of the date line and north of the equator are called hurricanes; see 1975 Pacific hurricane season. Tropical Storms formed in the entire west pacific basin were assigned a name by the Joint Typhoon Warning Center. Tropical depressions in this basin have the "W" suffix added to their number. Tropical depressions that enter or form in the Philippine area of responsibility are assigned a name by the Philippine Atmospheric, Geophysical and Astronomical Services Administration or PAGASA. This can often result in the same storm having two names.
Some of the notable storms here are Typhoon Nina, which caused the Banquiao Dam flood, which resulted in approximately 229,000 people dead, and Super Typhoon June, which was the strongest storm on record with a pressure of 875 mbar, until beaten by Typhoon Tip in 1979 with 870 mbar.
25 tropical depressions formed this year in the Western Pacific, of which 20 became tropical storms. 14 storms reached typhoon intensity, of which 3 reached super typhoon strength.
Typhoon Lola (Auring) was a very early typhoon. It made landfall on Mindanao as a minimal typhoon on January 24 and transversed the southern Philippines as a tropical storm. Lola crossed the South China Sea before stalling in the open sea and dissipating on January 28. The typhoon caused 30 casualties from mudslides and heavy rain.
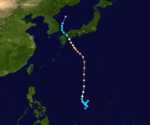
Nina was a short-lived but rapidly intensifying typhoon. After forming on July 30, it struck Taiwan at super typhoon intensity. It stayed a typhoon during its passage over the island, causing 25 fatalities and widespread damage. It emerged into the Formosa Strait and weakened to a tropical storm. Nina headed inland. Its moisture interacted with a cold front, causing a huge amount of rainfall. The rainfall contributed to the bursting of the Banqiao Dam, causing the deaths of around 200,000 people.
...
Wikipedia


