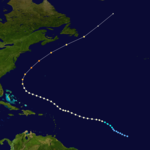
1975 Atlantic hurricane season
| 1975 Atlantic hurricane season |

Season summary map
|
| Seasonal boundaries |
| First system formed |
June 24, 1975 |
| Last system dissipated |
December 13, 1975 |
| Strongest storm |
|
| Name |
Gladys |
| • Maximum winds |
140 mph (220 km/h)
(1-minute sustained) |
| • Lowest pressure |
939 mbar (hPa; 27.73 inHg) |
| Seasonal statistics |
| Total depressions |
23 |
| Total storms |
9 |
| Hurricanes |
6 |
Major hurricanes
(Cat. 3+) |
3 |
| Total fatalities |
87 |
| Total damage |
$564.7 million (1975 USD) |
|
|
Atlantic hurricane seasons
1973, 1974, 1975, 1976, 1977
|
| Tropical storm (SSHWS) |
|
|
| Duration |
June 27 – July 4 |
| Peak intensity |
70 mph (110 km/h) (1-min) 981 mbar (hPa) |
| Category 1 hurricane (SSHWS) |
|
|
| Duration |
July 24 – July 28 |
| Peak intensity |
85 mph (140 km/h) (1-min) 980 mbar (hPa) |
| Tropical depression (SSHWS) |
|
|
| Duration |
July 27 – July 30 |
| Peak intensity |
35 mph (55 km/h) (1-min) |
| Category 3 hurricane (SSHWS) |
|
|
| Duration |
August 24 – September 1 |
| Peak intensity |
115 mph (185 km/h) (1-min) 963 mbar (hPa) |
| Category 2 hurricane (SSHWS) |
|
|
| Duration |
August 28 – September 4 |
| Peak intensity |
110 mph (175 km/h) (1-min) 965 mbar (hPa) |
| Category 3 hurricane (SSHWS) |
|
|
| Duration |
September 13 – September 24 |
| Peak intensity |
125 mph (205 km/h) (1-min) 955 mbar (hPa) |
| Category 2 hurricane (SSHWS) |
|
|
| Duration |
September 18 – September 29 |
| Peak intensity |
105 mph (165 km/h) (1-min) 977 mbar (hPa) |
| Category 4 hurricane (SSHWS) |
|
|
| Duration |
September 22 – October 3 |
| Peak intensity |
140 mph (220 km/h) (1-min) 939 mbar (hPa) |
| Tropical depression (SSHWS) |
|
|
| Duration |
October 14 – October 17 |
| Peak intensity |
35 mph (55 km/h) (1-min) |
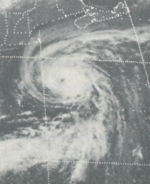
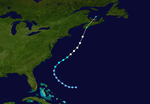
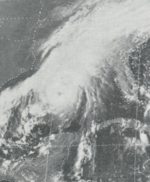
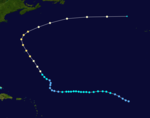
The 1975 Atlantic hurricane season featured the first tropical storm to be upgraded to a hurricane based solely on satellite imagery – Hurricane Doris. The season officially began on June 1 and lasted until November 30. These dates conventionally delimit the period of each year when most tropical cyclones form in the Atlantic basin. The season was near average, with nine tropical storms forming, of which six became hurricanes. Three of those six became major hurricanes, which are Category 3 or higher on the Saffir–Simpson scale. The first system, Tropical Depression One, developed on June 24. Tropical Storm Amy in July caused minor beach erosion and coastal flooding from North Carolina to New Jersey, and killed one person when a ship capsized offshore North Carolina. Hurricane Blanche brought strong winds to portions of Atlantic Canada, leaving about $6.2 million (1975 USD) in damage. Hurricane Caroline brought high tides and flooding to northeastern Mexico and Texas, with two drownings in the latter.
The most significant storm of the season was Hurricane Eloise, a Category 3 hurricane that struck the Florida Panhandle at peak intensity, after bringing severe flooding to the Caribbean. Eloise caused 80 fatalities, including 34 in Puerto Rico, 7 in Dominican Republic, 18 in Haiti, and 21 in the United States, with 4 in Florida. The hurricane left about $560 million in damage in the United States. Hurricane Gladys, a Category 4 hurricane, was the most intense tropical cyclone of the season, but left little impact on land. Two tropical depressions also caused damage and fatalities. Collectively, the tropical cyclones of this result resulted in 87 deaths and about $564.7 million in damage.
...
Wikipedia


