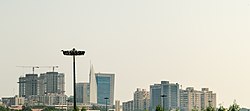
Pakistani economy

Karachi, the financial centre of Pakistan
|
|
| Currency |
Pakistani rupee (PKR) Rs.1 = 100 Paisas 1 USD = 105.3079 PKR (August 2017) |
|---|---|
| 1 July – 30 June | |
|
Trade organisations
|
WTO, SAARC, ECO, OIC, SAFTA, AIIB, SCO, IMF, Commonwealth of Nations, World Bank. |
| Statistics | |
| GDP | $1.060 Trillion (PPP, 2017), 31862.2 Billion Rupees Or $304.3 Billion (Nominal, 2017) |
| GDP rank | 25th (PPP, 2017) 42nd (Nominal, 2015) |
|
GDP growth
|
|
|
GDP per capita
|
$1,629 (nominal; 150th;2016) $5,374 (PPP; 133rd; 2016) |
|
GDP by sector
|
|
|
|
|
Population below poverty line
|
21% (2016) |
|
|
|
|
Labour force
|
61.04 million (2015–16) |
|
Labour force by occupation
|
|
| Unemployment | 5.9% (2015) |
|
Main industries
|
textiles and apparel, food processing, pharmaceuticals, construction materials, chemicals, cement, mining, machinery, steel, engineering, software and hardware, automobiles, motorcycle and auto parts, electronics, paper products, fertiliser, shrimp, defence products, shipbuilding |
| 144th (2017) | |
| External | |
| Exports |
|
|
Export goods
|
Textiles Vegetable Products Mineral ($1,082 million) Leather Food and Beverages |
|
Main export partners
|
|
| Imports |
|
|
Import goods
|
Food $558.9 million Machinery $6414.6 million Transport Vehicles $2361.0 million Textile $3381.8 million Fertilizers and other chemicals $4793.4 billion Refined Petroleum $4846.0 million Crude Petroleum $1840.7 million |
|
Main import partners
|
|
| Public finances | |
|
|
|
| Revenues |
|
| Expenses |
|
|
|
|
Foreign reserves
|
|
Pakistani rupee (PKR) Rs.1 = 100 Paisas
$1,629 (nominal; 150th;2016)
![]() China 28%
China 28%![]() United Arab Emirates 14%
United Arab Emirates 14%![]() Kuwait 8%
Kuwait 8%![]() Saudi Arabia 6%
Saudi Arabia 6%![]() Indonesia 5% (2017 est.)
Indonesia 5% (2017 est.)
...
Wikipedia
