2009-10 Australian region cyclone season
| 2009–10 Australian region cyclone season |

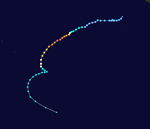
Season summary map
|
| Seasonal boundaries |
| First system formed |
8 December 2009 |
| Last system dissipated |
25 April 2010 |
| Strongest storm |
|
| Name |
Laurence |
| • Maximum winds |
205 km/h (125 mph)
(10-minute sustained) |
| • Lowest pressure |
925 hPa (mbar) |
|
| Seasonal statistics |
| Tropical lows |
13 |
| Tropical cyclones |
8 |
| Severe tropical cyclones |
4 |
| Total fatalities |
3 total |
| Total damage |
$681 million (2010 USD) |
| Related articles |
|
|
Australian region tropical cyclone seasons
2007–08, 2008–09, 2009–10, 2010–11, 2011–12
|
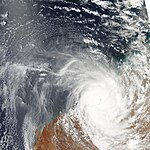
| Category 5 severe tropical cyclone (Australian scale) |
| Category 4 tropical cyclone (SSHWS) |
|
|
| Duration |
8 December – 23 December |
| Peak intensity |
205 km/h (125 mph) (10-min) 925 hPa (mbar) |
| Tropical low (Australian scale) |
|
|
| Duration |
27 December – 6 January |
| Peak intensity |
45 km/h (30 mph) (10-min) 991 hPa (mbar) |
| Tropical low (Australian scale) |
| Tropical depression (SSHWS) |
|
|
| Duration |
1 January – 4 January (Exited Basin)
|
| Peak intensity |
55 km/h (35 mph) (10-min) 1000 hPa (mbar) |
| Tropical low (Australian scale) |
|
|
| Duration |
14 January – 21 January |
| Peak intensity |
Winds not specified |
| Category 1 tropical cyclone (Australian scale) |
|
|
| Duration |
19 January – 21 January |
| Peak intensity |
65 km/h (40 mph) (10-min) 995 hPa (mbar) |
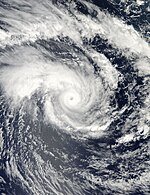
| Category 3 severe tropical cyclone (Australian scale) |
| Category 1 tropical cyclone (SSHWS) |
|
|
| Duration |
19 January – 24 January |
| Peak intensity |
130 km/h (80 mph) (10-min) 975 hPa (mbar) |
| Category 2 tropical cyclone (Australian scale) |
| Tropical storm (SSHWS) |
|
|
| Duration |
20 January – 30 January |
| Peak intensity |
95 km/h (60 mph) (10-min) 983 hPa (mbar) |
| Tropical low (Australian scale) |
|
|
| Duration |
22 February – 24 February |
| Peak intensity |
Winds not specified |
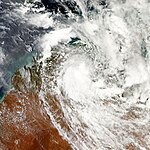
| Category 4 severe tropical cyclone (Australian scale) |
| Category 4 tropical cyclone (SSHWS) |
|
|
| Duration |
14 March – 21 March |
| Peak intensity |
195 km/h (120 mph) (10-min) 937 hPa (mbar) |
The 2009–10 Australian region cyclone season was a below average tropical cyclone season, with eight tropical cyclones forming compared to an average of 12. The season began on 1 November 2009 and ran through until it end on 30 April 2010. The Australian region is defined as being to south of the equator, between the 90th meridian east and 160th meridian east. Tropical cyclones in this area are monitored by five Tropical Cyclone Warning Centres (TCWC's): Jakarta, Port Moresby, Perth, Darwin, and Brisbane, each of which have the power to name a tropical cyclone. The TCWC's in Perth, Darwin, and Brisbane are run by the Australian Bureau of Meteorology, who designate significant tropical lows with a number and the U suffix. The Joint Typhoon Warning Center also issues unofficial warnings for the region, designating significant tropical cyclones with the "S" suffix when they form west of 135°E, and the "P" suffix when they form east of 135°E.
Torrential rains produced by Tropical Cyclones Olga and Paul resulted in widespread flooding and damage in northern Australia. The combined losses from these storms reached A$508 million (US$500 million).
For the first time this season, the Bureau of Meteorology's National Climate Center (NCC), issued a seasonal forecast for the whole basin between 90°E and 160°E and included forecasts for TCWC Jakarta and Port Moresby's area of responsibility. The NCC issued four separate forecasts, one for the whole basin and three for the subregions Western Northern and Eastern with each one covering the whole tropical cyclone year. For the whole region the NCC forecast that 7–13 tropical cyclones would develop or move into the region, compared with an average of 12 tropical cyclones. For the Western region, which the NCC defined as being between 90°E and 125°E, they forecast that 5–8 tropical cyclones would develop or move into the region compared to an average of seven. For the Northern region which the NCC defined as being between 125°E and 142.5°E, they forecast that 3–4 tropical cyclones would develop and/or move through the region compared to an average of four. However they also noted that the model used for predicting cyclones in this area had a "low skill." For the Eastern region which the NCC defined as being between 142.5°E and 160°E, they reported that 3–4 tropical cyclones would also develop and/or move through the region compared to an average of four.
For the first time, the Guy Carpenter Asia-Pacific Climate Impact Centre (GCACIC), of the City University of Hong Kong (CityUHK), have issued a forecasts of tropical cyclone activity for the cyclone season. A forecast predicting how many tropical cyclones there will be within the Australian region as a whole and for the western part of the basin between 90°E and 135°E, was released in November. For this season, the GCACIC predicted that the region as a whole would see activity, near the average, predicting that 8 tropical cyclones will be in the region, with 5 of them within the western part of the region.
...
Wikipedia


