1956 Atlantic hurricane season
| 1956 Atlantic hurricane season |

Season summary map
|
| Seasonal boundaries |
| First system formed |
June 7, 1956 |
| Last system dissipated |
November 21, 1956 |
| Strongest storm |
|
| Name |
Betsy |
| • Maximum winds |
120 mph (195 km/h) |
| • Lowest pressure |
954 mbar (hPa; 28.17 inHg) |
| Seasonal statistics |
| Total depressions |
15 |
| Total storms |
12 |
| Hurricanes |
4 |
Major hurricanes
(Cat. 3+) |
1 |
| Total fatalities |
76 overall |
| Total damage |
$67.8 million (1956 USD) |
|
|
Atlantic hurricane seasons
1954, 1955, 1956, 1957, 1958
|
| Tropical storm (SSHWS) |
|
|
| Duration |
June 7 – June 10 |
| Peak intensity |
45 mph (75 km/h) (1-min) ≤ 1001 mbar (hPa) |
| Tropical storm (SSHWS) |
|
|
| Duration |
June 12 – June 15 |
| Peak intensity |
60 mph (95 km/h) (1-min) 1001 mbar (hPa) |
| Category 1 hurricane (SSHWS) |
|
|
| Duration |
July 25 – July 27 |
| Peak intensity |
85 mph (140 km/h) (1-min) ≤ 991 mbar (hPa) |
| Category 3 hurricane (SSHWS) |
|
|
| Duration |
August 9 – August 21 (extratropical after August 18)
|
| Peak intensity |
120 mph (195 km/h) (1-min) 954 mbar (hPa) |
| Tropical storm (SSHWS) |
|
|
| Duration |
September 7 – September 16 (extratropical after September 10)
|
| Peak intensity |
60 mph (95 km/h) (1-min) ≤ 996 mbar (hPa) |
| Tropical storm (SSHWS) |
|
|
| Duration |
September 10 – September 13 |
| Peak intensity |
60 mph (95 km/h) (1-min) 1000 mbar (hPa) |
| Tropical storm (SSHWS) |
|
|
| Duration |
September 11 – September 14 |
| Peak intensity |
60 mph (95 km/h) (1-min) 999 mbar (hPa) |
| Category 1 hurricane (SSHWS) |
|
|
| Duration |
September 20 – October 3 (extratropical after September 25)
|
| Peak intensity |
90 mph (150 km/h) (1-min) 974 mbar (hPa) |
| Tropical storm (SSHWS) |
|
|
| Duration |
October 9 – October 12 |
| Peak intensity |
45 mph (75 km/h) (1-min) ≤ 1004 mbar (hPa) |
The 1956 Atlantic hurricane season featured a low number of tropical cyclones, although every tropical storm and hurricane affected land. There were twelve tropical storms, a third of which became hurricanes. One of the hurricanes strengthened to the equivalent of a major hurricane, which is a Category 3 or greater on the Saffir-Simpson scale. The strongest hurricane of the season was Betsy, which was also the most damaging storm of the season: it destroyed 15,000 houses and left $40 million in damage in Puerto Rico. Betsy was also the deadliest of the season, having killed 18 people in the French West Indies, two from a shipwreck in the Caribbean Sea, and 16 in Puerto Rico. Tropical Storm Dora struck Mexico in September and killed 27 people.
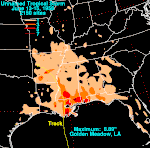
The season officially started on June 15, although an unnamed storm developed about a week prior over the western North Atlantic Ocean. A later storm that formed over the Gulf of Mexico on June 12 alleviated drought conditions in the south-central United States. Hurricane Anna developed in late July and hit Mexico. Tropical storms Carla and Ethel both formed near the Bahamas and moved northeastward until dissipating. The lone hurricane that hit the contiguous United States was Hurricane Flossy. One of the final storms of the year, Greta, was an unusually large hurricane that produced high waves from Florida to the Lesser Antilles. It developed in the western Caribbean and moved across much of the southeastern United States, causing $24.8 million in damage and 15 deaths. There were also several tropical depressions, as well as one subtropical cyclone, in the season.
The season officially began on June 15, the date that the Weather Bureau office in Miami, Florida, under the direction of Gordon Dunn, began daily monitoring of all tropical disturbances and cyclones across the northern Atlantic Ocean. The agency had access to the Hurricane Hunters, a fleet of aircraft that obtain data by flying into storms. The Weather Bureau, in collaboration with other agencies, began a five–year project in 1956 to obtain and analyze data on the structure of hurricanes. The season officially ended on November 15.
...
Wikipedia


