1954 Atlantic hurricane season
| 1954 Atlantic hurricane season |

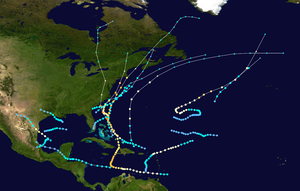
Season summary map
|
| Seasonal boundaries |
| First system formed |
May 28, 1954 |
| Last system dissipated |
January 6, 1955 (tied record latest with 2005)
|
| Strongest storm |
|
| Name |
Hazel |
| • Maximum winds |
130 mph (215 km/h)
(1-minute sustained) |
| • Lowest pressure |
938 mbar (hPa; 27.7 inHg) |
| Seasonal statistics |
| Total depressions |
17 |
| Total storms |
16 |
| Hurricanes |
7 |
Major hurricanes
(Cat. 3+) |
3 |
| Total fatalities |
1069 |
| Total damage |
$751.6 million (1954 USD) |
|
|
Atlantic hurricane seasons
1952, 1953, 1954, 1955, 1956
|
| Tropical storm (SSHWS) |
|
|
| Duration |
May 28 – May 30 |
| Peak intensity |
50 mph (85 km/h) (1-min) ≤ 997 mbar (hPa) |
| Tropical storm (SSHWS) |
|
|
| Duration |
June 18 – June 24 |
| Peak intensity |
70 mph (110 km/h) (1-min) 994 mbar (hPa) |
| Category 2 hurricane (SSHWS) |
|
|
| Duration |
June 24 – June 27 |
| Peak intensity |
110 mph (175 km/h) (1-min) ≤ 975 mbar (hPa) |
| Tropical storm (SSHWS) |
|
|
| Duration |
July 10 – July 14 |
| Peak intensity |
50 mph (85 km/h) (1-min) ≤ 1004 mbar (hPa) |
| Tropical storm (SSHWS) |
|
|
| Duration |
July 27 – July 30 |
| Peak intensity |
60 mph (95 km/h) (1-min) 999 mbar (hPa) |
| Category 3 hurricane (SSHWS) |
|
|
| Duration |
August 25 – August 31 |
| Peak intensity |
115 mph (185 km/h) (1-min) 955 mbar (hPa) |
| Category 1 hurricane (SSHWS) |
|
|
| Duration |
August 31 – September 2 |
| Peak intensity |
85 mph (140 km/h) (1-min) ≤ 994 mbar (hPa) |
| Category 3 hurricane (SSHWS) |
|
|
| Duration |
September 2 – September 15 |
| Peak intensity |
125 mph (205 km/h) (1-min) 943 mbar (hPa) |
| Tropical storm (SSHWS) |
|
|
| Duration |
September 6 – September 7 |
| Peak intensity |
45 mph (75 km/h) (1-min) 1004 mbar (hPa) |
The 1954 Atlantic hurricane season resulted in over $750 million in damage, the most of any season at the time. The season officially began on June 15, and nine days later the first named storm developed. Hurricane Alice developed in the Gulf of Mexico and moved inland along the Rio Grande, producing significant precipitation and record flooding that killed 55 people. Activity was slow until late August; only Barbara, a minimal tropical storm, developed in July. In the span of two weeks, hurricanes Carol and Edna followed similar paths before both striking New England as major hurricanes. The latter became the costliest hurricane in Maine's history.
In late September, Tropical Storm Gilda killed 29 people after drenching northern Honduras. A tropical depression in early October was captured by a high-altitude photograph on a rocket, thus producing the first large-scale image of a tropical cyclone. The strongest and deadliest hurricane of the season was Hurricane Hazel, which killed thousands in Haiti before striking near the North Carolina/South Carolina border in October. It caused heavy damage in the United States before becoming extratropical and affecting Ontario. Intense rainfall affected Toronto with severe flooding, leaving significant damage. The season officially ended on November 15, although another hurricane named Alice developed on December 30 to the northeast of the Lesser Antilles; it lasted until January 6 of the following year. In total, there were 16 tropical storms, 7 hurricanes, and 3 major hurricanes.
The hurricane season officially began on June 15, when the United States Weather Bureau in Miami, Florida began 24‑hour operations. The agency, under the direction of Grady Norton had access to 43 other weather stations across the Atlantic basin. Norton died during the season from a stroke while tracking Hurricane Hazel. Additionally, a group of Hurricane Hunters planes were put on standby for the season, able to be flown out into storms and collect data. During the season, there were eight named storms, as well as an unnamed hurricane and a tropical depression. The season officially ended on November 15, although an unnamed tropical storm formed a day later. In addition, Tropical Storm Alice developed on December 31, the latest a tropical cyclone has developed in the calendar year.
...
Wikipedia


