1913 Atlantic hurricane season
| 1913 Atlantic hurricane season | |
|---|---|

Season summary map
|
|
| Seasonal boundaries | |
| First system formed | May 5, 1913 |
| Last system dissipated | October 30, 1913 |
| Strongest storm | |
| Name | Four |
| • Maximum winds | 85 mph (140 km/h) |
| • Lowest pressure | 976 mbar (hPa; 28.82 inHg) |
| Seasonal statistics | |
| Total depressions | 10 |
| Total storms | 6 |
| Hurricanes | 4 |
| Total fatalities | 6 |
| Total damage | At least $4 million (1913 USD) |
| Category 1 hurricane (SSHWS) | |
| Duration | June 21 – June 29 |
|---|---|
| Peak intensity | 75 mph (120 km/h) (1-min) 988 mbar (hPa) |
| Tropical storm (SSHWS) | |
| Duration | August 14 – August 16 |
|---|---|
| Peak intensity | 45 mph (75 km/h) (1-min) <1008 mbar (hPa) |
| Tropical storm (SSHWS) | |
| Duration | August 26 – September 12 |
|---|---|
| Peak intensity | 70 mph (110 km/h) (1-min) <995 mbar (hPa) |
| Category 1 hurricane (SSHWS) | |
| Duration | August 30 – September 4 |
|---|---|
| Peak intensity | 85 mph (140 km/h) (1-min) 976 mbar (hPa) |
| Category 1 hurricane (SSHWS) | |
| Duration | October 6 – October 10 |
|---|---|
| Peak intensity | 75 mph (120 km/h) (1-min) 989 mbar (hPa) |
| Category 1 hurricane (SSHWS) | |
| Duration | October 28 – October 30 |
|---|---|
| Peak intensity | 75 mph (120 km/h) (1-min) <992 mbar (hPa) |
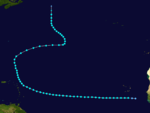
The 1913 Atlantic hurricane season was the third consecutive year with a tropical cyclone developing before June. Although no "hurricane season" was defined at the time, the present-day delineation of such is June 1 to November 30. The first system, a tropical depression, developed on May 5 while the last transitioned into an extratropical cyclone on October 30. Of note, the seventh and eighth cyclones existed simultaneously from August 30 to September 4.
Of the season's ten tropical cyclones, six became tropical storms and four strengthened into hurricanes. Furthermore, none of these strengthened into a major hurricane—Category 3 or higher on the modern-day Saffir–Simpson hurricane wind scale—marking the sixth such occurrence since 1900. The strongest hurricane of the season peaked as only a Category 1 with winds of 85 mph (140 km/h). That system left five deaths and at least $4 million in damage in North Carolina. The first hurricane of the season also caused one fatality in Texas, while damage in South Carolina from the fifth hurricane reached at least $75,000.
The season's activity was reflected with an accumulated cyclone energy (ACE) rating of 36. ACE is, broadly speaking, a measure of the power of the hurricane multiplied by the length of time it existed, so storms that last a long time, as well as particularly strong hurricanes, have high ACEs. It is only calculated for full advisories on tropical systems at or exceeding 39 mph (63 km/h), which is tropical storm strength.
Weather maps and ship data indicate the development of a tropical depression in the southwestern Caribbean Sea around 06:00 UTC on June 21. Moving north-northwestward, the depression accelerated and intensified into a tropical storm on the following day. Early on June 23, the storm made landfall near the Honduras–Nicaragua border with winds of 40 mph (65 km/h). Thereafter, it continued north-northwestward and oscillated slightly in strength. The system made another landfall near Cancún, Quintana Roo, with winds of 45 mph (75 km/h) late on June 25. After briefly crossing the Yucatan Peninsula, the cyclone emerged into the Gulf of Mexico and eventually began moving more to the west-northwest. Early on June 27, it deepened into a Category 1 hurricane and peaked with maximum sustained winds of 75 mph (120 km/h). The hurricane then curved northwestward and made landfall in Padre Island, Texas, at the same intensity around 01:00 UTC on June 28. After moving inland, the storm quickly weakened and dissipated over Val Verde County just under 24 hours later.
...
Wikipedia


