San Antonio, Texas
| San Antonio, Texas | |||||
|---|---|---|---|---|---|
| City | |||||
| City of San Antonio | |||||

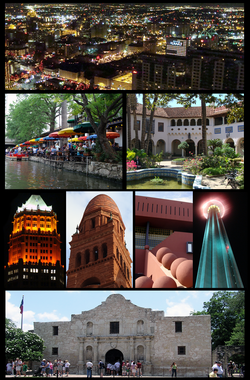
From top to bottom and Left to Right: 1. San Antonio downtown from the Tower of The Americas at night. 2. The Riverwalk 3. The McNay Museum of Art 4. The Tower Life Building 5. Bexar County courthouse 6. San Antonio Public Library 7. The Tower of the Americas at night 8. The Alamo
|
|||||
|
|||||
| Nickname(s): S.A., River City, Alamo City, Military City USA, Countdown City |
|||||
| Motto: Libertatis cunabula (Latin, Cradle of liberty) | |||||
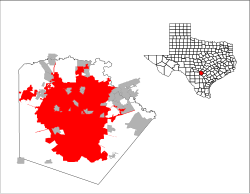
 Location in Bexar County in the state of Texas |
|||||
| Location in Texas | |||||
| Coordinates: 29°25′N 98°30′W / 29.417°N 98.500°W | |||||
| Country | |||||
| State |
|
||||
| Counties | Bexar, Medina, Comal | ||||
| Foundation | May 1, 1718 | ||||
| Incorporated | June 5, 1837 | ||||
| Named for | Saint Anthony of Padua | ||||
| Government | |||||
| • Type | Council-Manager | ||||
| • Body | San Antonio City Council | ||||
| • Mayor | Ivy Taylor (I) | ||||
| • City Manager | Sheryl Sculley | ||||
| • City Council |
List
|
||||
| Area | |||||
| • City | 465.4 sq mi (1,205.4 km2) | ||||
| • Land | 460.93 sq mi (1,193.7 km2) | ||||
| • Water | 4.5 sq mi (11.7 km2) | ||||
| Elevation | 650 ft (198 m) | ||||
| Population (2014) | |||||
| • City | 1,436,697 (est.) | ||||
| • Density | 3,000.35/sq mi (1,147.3/km2) | ||||
| • Metro | 2,328,652 (25th) | ||||
| • Demonym | San Antonian | ||||
| Time zone | CST (UTC−6) | ||||
| • Summer (DST) | CDT (UTC−5) | ||||
| Zip code | 78201-66, 78268-70, 78275, 78278-80, 78283-89, 78291-99 | ||||
| Area code(s) | 210 (majority), 830 (portions), 726 (planned) | ||||
| Interstates |
|
||||
| Website | www.SanAntonio.gov | ||||
| San Antonio | ||||||||||||||||||||||||||||||||||||||||||||||||||||||||||||
|---|---|---|---|---|---|---|---|---|---|---|---|---|---|---|---|---|---|---|---|---|---|---|---|---|---|---|---|---|---|---|---|---|---|---|---|---|---|---|---|---|---|---|---|---|---|---|---|---|---|---|---|---|---|---|---|---|---|---|---|---|
| Climate chart () | ||||||||||||||||||||||||||||||||||||||||||||||||||||||||||||
|
||||||||||||||||||||||||||||||||||||||||||||||||||||||||||||
|
||||||||||||||||||||||||||||||||||||||||||||||||||||||||||||
| J | F | M | A | M | J | J | A | S | O | N | D |
|
1.8
62
39
|
1.8
67
42
|
2.3
74
50
|
2.1
80
57
|
4
86
66
|
4.1
91
72
|
2.7
95
74
|
2.1
95
74
|
3
90
69
|
4.1
82
59
|
2.3
71
49
|
1.9
Wikipedia
...
|


