New Hampshire Democratic primary, 2012
|
|
||||||||||||||||||||||||||
|---|---|---|---|---|---|---|---|---|---|---|---|---|---|---|---|---|---|---|---|---|---|---|---|---|---|---|
|
||||||||||||||||||||||||||
|
||||||||||||||||||||||||||

County Results
Obama—60-70%
Obama—50-60%
Obama—<50%
Romney—<50%
Romney—50-60%
|
||||||||||||||||||||||||||
|
||||||||||||||||||||||||||
|
|
|||||||||||||||||||||||||||||||||||||||||||||||
|---|---|---|---|---|---|---|---|---|---|---|---|---|---|---|---|---|---|---|---|---|---|---|---|---|---|---|---|---|---|---|---|---|---|---|---|---|---|---|---|---|---|---|---|---|---|---|---|
|
|||||||||||||||||||||||||||||||||||||||||||||||
|
|||||||||||||||||||||||||||||||||||||||||||||||

New Hampshire results by county
Mitt Romney
Ron Paul
|
|||||||||||||||||||||||||||||||||||||||||||||||
| New Hampshire Republican primary, February 10, 2012 - certified result | |||||
|---|---|---|---|---|---|
| Candidate | Votes | Percentage | Projected delegate count | ||
| AP | CNN | GP | |||
| Mitt Romney | 97,591 | 39.28% | 8 | 8 | 7 |
| Ron Paul | 56,872 | 22.89% | 3 | 3 | 3 |
| Jon Huntsman | 41,964 | 16.89% | 1 | 0 | 2 |
| Rick Santorum | 23,432 | 9.43% | 0 | 0 | 0 |
| Newt Gingrich | 23,421 | 9.43% | 0 | 0 | 0 |
| Rick Perry | 1,764 | 0.71% | 0 | 0 | 0 |
| Buddy Roemer | 950 | 0.38% | 0 | 0 | 0 |
| Michele Bachmann (withdrawn) | 350 | 0.14% | 0 | 0 | 0 |
| Fred Karger | 345 | 0.14% | 0 | 0 | 0 |
| Barack Obama (write-in) | 285 | 0.11% | 0 | 0 | 0 |
| Kevin Rubash | 250 | 0.10% | 0 | 0 | 0 |
| Gary Johnson (withdrawn) | 181 | 0.07% | 0 | 0 | 0 |
| Herman Cain (withdrawn) | 161 | 0.06% | 0 | 0 | 0 |
| Jeff Lawman | 119 | 0.05% | 0 | 0 | 0 |
| Chris Hill | 108 | 0.04% | 0 | 0 | 0 |
| Benjamin Linn | 83 | 0.03% | 0 | 0 | 0 |
| Michael Meehan | 54 | 0.02% | 0 | 0 | 0 |
| Keith Drummond | 42 | 0.02% | 0 | 0 | 0 |
| Rickey Story | 42 | 0.02% | 0 | 0 | 0 |
| Bear Betzler | 29 | 0.01% | 0 | 0 | 0 |
| Joe Robinson | 25 | 0.01% | 0 | 0 | 0 |
| Stewart Greenleaf | 24 | 0.01% | 0 | 0 | 0 |
| Donald Trump (write-in) | 24 | 0.01% | 0 | 0 | 0 |
| Sarah Palin (write-in) | 23 | 0.01% | 0 | 0 | 0 |
| Mark Callahan | 20 | 0.01% | 0 | 0 | 0 |
| Andy Martin | 19 | 0.01% | 0 | 0 | 0 |
| Linden Swift | 18 | 0.01% | 0 | 0 | 0 |
| Tim Brewer | 15 | 0.01% | 0 | 0 | 0 |
| Vern Wuensche | 15 | 0.01% | 0 | 0 | 0 |
| L. John Davis | 14 | 0.01% | 0 | 0 | 0 |
| Randy Crow | 12 | 0.00% | 0 | 0 | 0 |
| Vermin Supreme (write-in) | 4 | 0.00% | 0 | 0 | 0 |
| James Vestermark | 3 | 0.00% | 0 | 0 | 0 |
| Hugh Cort | 3 | 0.00% | 0 | 0 | 0 |
| Other Write-ins | 213 | 0.09% | 0 | 0 | 0 |
| Total: | 248,475 | 100.00% | 12 | 11 | 12 |
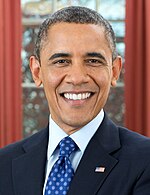
The 2012 United States presidential election in New Hampshire took place on November 6, 2012 as part of the 2012 General Election in which all 50 states plus The District of Columbia participated. New Hampshire voters chose four electors to represent them in the Electoral College via a popular vote pitting incumbent Democratic President Barack Obama and his running mate, Vice President Joe Biden, against Republican challenger and former Massachusetts Governor Mitt Romney and his running mate, Congressman Paul Ryan.
On election day, New Hampshire voters chose to re-elect President Barack Obama, giving Obama 51.98% of the vote to Mitt Romney's 46.40%, a Democratic victory margin of 5.58%.
New Hampshire held its primaries on January 10, 2012. The state is historically the first in the nation to hold presidential primaries, and moved its date up from February after Florida moved its primary date to January 31. Because New Hampshire has a proportional-delegate primary, the state's 12 national delegates will be allocated in proportion to candidates' percent of the popular vote.
...
Wikipedia


